I have an Interface Utilization Report I created for our WAN routers and I need the report to show "Last Months" data...IE 5/01/2016 - 5/31/2016.
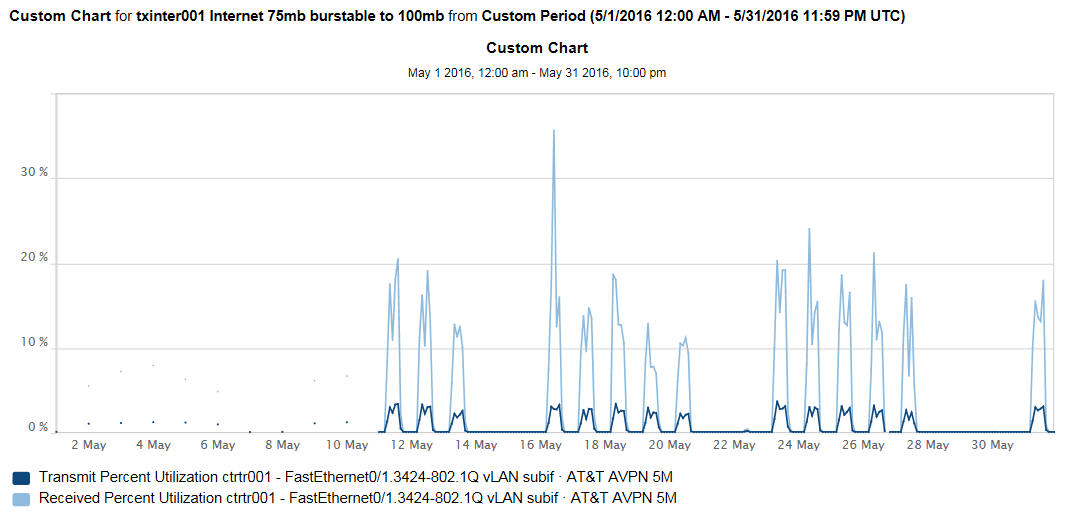
Why does the graph not go back to the 1st of the month? I see the dots but no graph lines?
Thank you!!!
-Nick
Message was edited by: Nick ChenaultI think I found my problem...Hourly Statistics Retention is set to 30 days and I'm trying to view by the hour past 30 days.Is there any risk in changing this to 60 days? I would imagine it would just affect storage space.