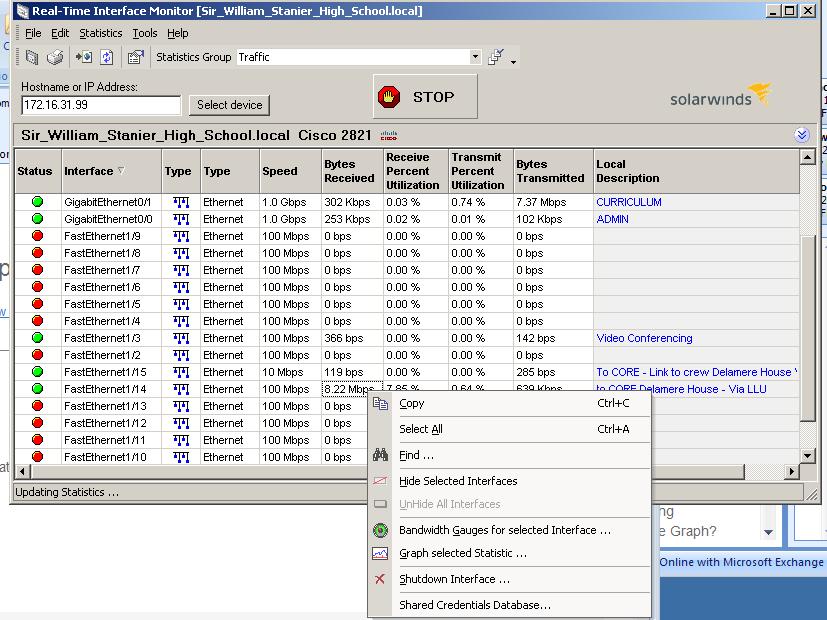
Hello - Recently upgraded to toolset v10 - Launched real-time monitor and pleasantly surprised when I hovered over a value in Bytes received column and was offered the option to graph statistics - Now this is going to be really useful , I can finally get the granularity of bandwidth on a specific problem interface that I struggle to achieve elsewhere !!
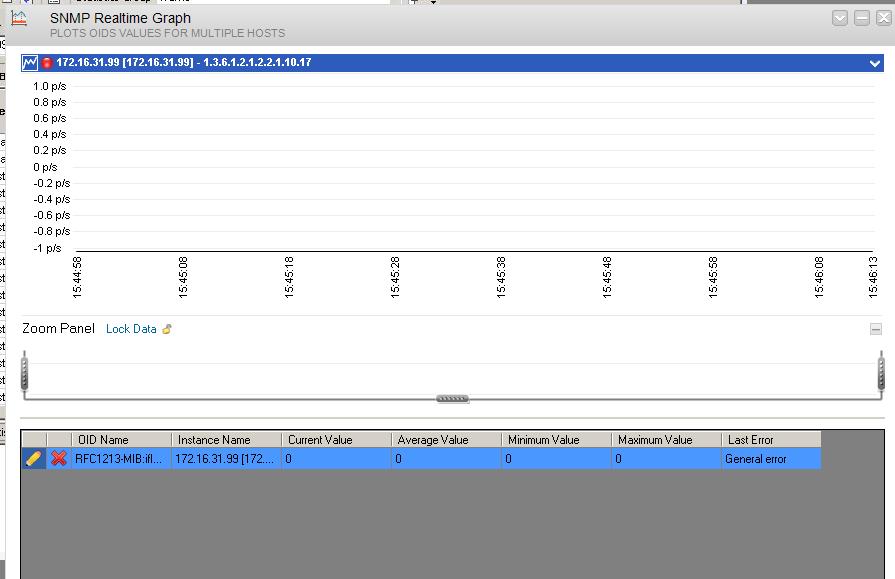
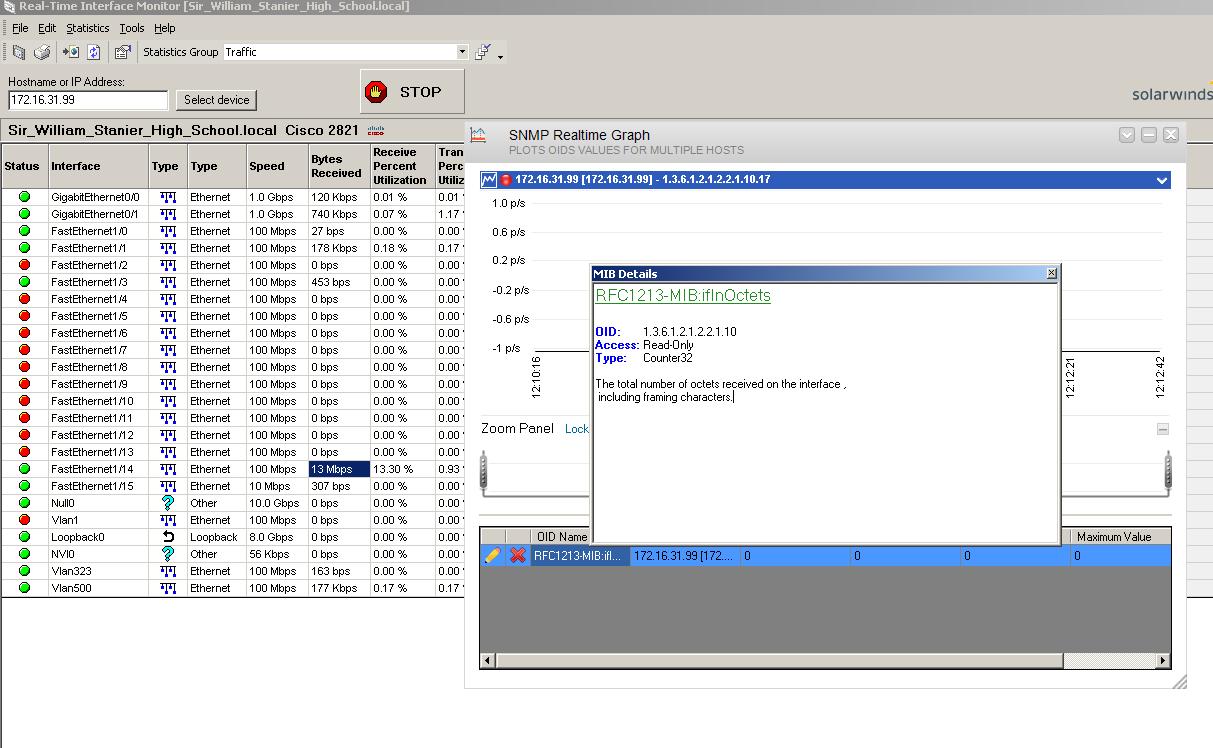
Sadly the expected window did not appear - The vertical axis showed between +2 p/s and -2p/s ?
Any advice would be much appreciated