or How to Display a Lot of Data in a Small Space
How do you summarise data down to a simple numbers, and still provide enough detail for users to see the details - and not run out of space? My first solution to this was to embed a table. This was the result:
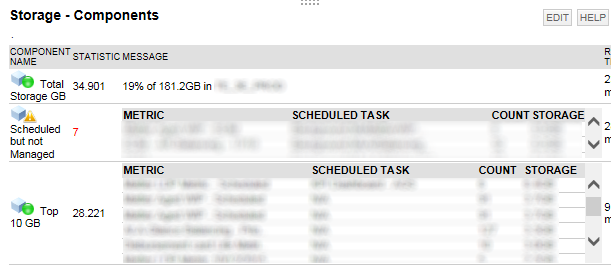
The three monitors you can see were all build using the SQL Server User Experience Monitor component. The tables are constructed in the SQL, and everything is wrapped in a DEV set to show scroll-bars when required. For simplicity, it is broken up into three parts - description follows after the code...
with det as (
    select '<TD>' +
            case when len(Last_Metric_Run_Name) > 30 THEN
                    '<span title="' + Metric_Name + '">' + left(Metric_Name, 28) + '..</span>'
            else
                coalesce(Last_Metric_Run_Name, 'N/A' )
            end
            + '</TD><TD>' + case when len(Scheduled_Task_Name) > 30 THEN '<span title="' + Scheduled_Task_Name + '">' +
                        + case when charindex(',', Scheduled_Task_Name) > 0 then
                            left(Scheduled_Task_Name,  charindex(',', Scheduled_Task_Name) )
                          ELSE
                            left(Scheduled_Task_Name, 28)
                          END
                        + '..</span>'
                        ELSE
                            coalesce(Scheduled_Task_Name, 'N/A' )
                        END
            + '</TD><TD>' + cast(metric_Count as varchar(10))
            + '</TD><TD>' +  cast( cast(size_mb/1024.0 as numeric(10,1)) as varchar(20) ) + 'GB'
            + '</TD>' as dsc
        ,size_mb
    from  dbo.Metrics
)
,p2 as(
    SELECT distinct count(*) over (partition by 1) as Result
        ,descs = STUFF((SELECT N'</TR><TR>' + dsc
      FROM det AS p2
       ORDER BY size_mb desc
       FOR XML PATH(N''), TYPE).value(N'.[1]', N'nvarchar(max)'), 1, 5, N'')
    FROM det AS p
    --
    --where  Delete_After is null and scheduled_task_name is not null
)
select Result, '<div style="width: 480px; height: 50px;overflow:auto; background-color:white;" > <TABLE><thead><TR><TH>Metric</TH><TH>Scheduled Task</TH><TH>Count</TH><TH>Storage</TH></TR></thead><tbody>'  + descs + '</TR></tbody></TABLE></div>'  as Msg
from p2
DET (for Detail)
This returns several rows of data, and for neatness, if the text is too long (characters > 30), truncates it and adds a tool-tip with the full text. Each column to display in the final table the row is wrapped in <TD> tags. The second column is there to sort the rows by in the next query step. This is an example resultset for DET:

P2
This takes the rows of data from DET, and appends them all together, separated by <TR> tags to define the rows. The rows appear in order of the last column - size_mb. The first column is to eventually be used as the metric - in this case, the number of records returned. I could also be a sum or another value - like the size_mb column I have here for example. The definition of this may look a bit funky because it is using the SQL Analytics function -
count(*) over (partition by 1) as Result
- but if you don't know what this is doing, just change the count(*) to another aggregate function you may typically use in a standard grouped query.
The descs column is the final table contents. This is an example result-set for P2:

Final Query
This is where you define the size of the scroll-box on screen - so that your results will never fill up the screen. It is also where you define the table headers (if you want them). You can see I have specified a box that is 480px by 50px.
Conclusion
If you want to use this method yourself, do the following:
- write a query to return the detailed results you want, and put that into the DET section. It should return two rows of data - one for the text and one for the sort key.
- typically leave P2 alone - unless you change the column used for sorting
- adjust the final query to match the size you need, and the column headers you want to see.
If you are paying attention, you may have noticed that the box size can be wider than the standard description field, as the box pushes the response time out of the way - so don't feel too cramped.
I hope this has been of value. The follow-on article to this will go go into the dynamic html methods available thanks for Solarwinds use of Node.js. Expandable boxes and the like.