After Estate Wave, I wanted to explore another way of presenting node data directly inside SolarWinds. Apparently, the next step was adding gravity..
Estate Gravity places monitored nodes across an interactive particle field. Nodes with valid CPU readings above 80% create visual wells, with higher utilisation contributing more weight to the landscape.

You can:
- Rotate the landscape and select individual nodes.
- Inspect CPU, memory, response time, packet loss and reported node status, with a link to the node page.
- Filter the particles to show only nodes with CPU above 80%.
- Switch gravity off to flatten the field, then watch the wells form again.
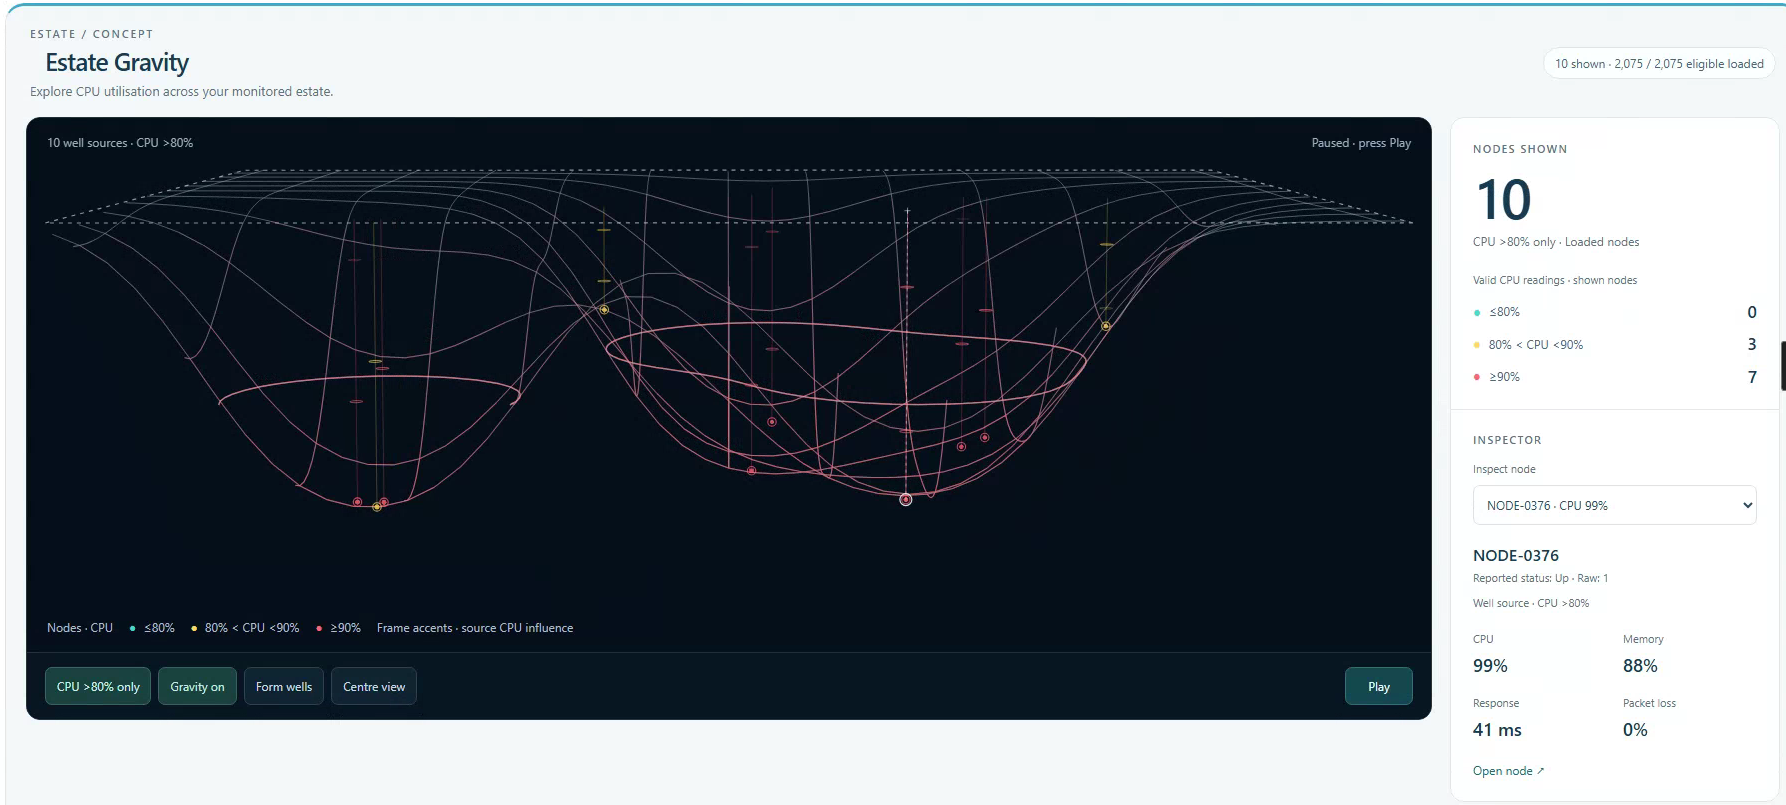
The animation is illustrative and uses stored readings loaded when the dashboard refreshes. It does not show CPU changing over time or dependencies between neighbouring nodes.
This is another personal experiment with how we present and interact with monitoring data inside SolarWinds.
Thanks again for allowing THWACK to be a place for me to share this content
✌️