Topics:
- Kill SQL Session in DPA
- Name SQL Statements
- Create Custom Alerts
- Identifying Idle Blockers
- Personalize Resources: Custom Metric Threshold
- Annotations
- DPA Introduction
- Find SQL
- Create Report Groups
- Exclude SQL Statements
- Central Management
Here are the following DPA Hidden Gems:
A. Kill SQL Session in DPA
- Navigate to the server that is experiencing slow performance
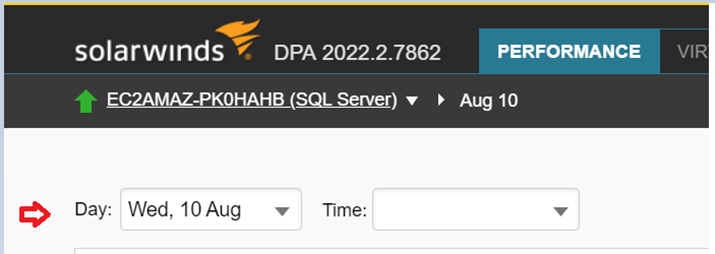
- Filter by Day and Time at the top left of the page
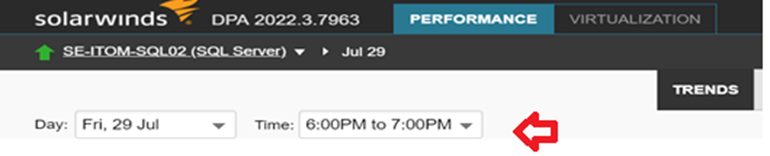
- Click 'Current' at the top right of the page

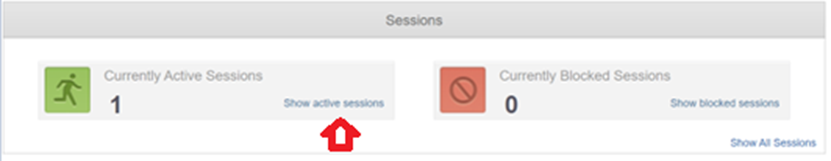
- Scroll down and click on 'Show active sessions'
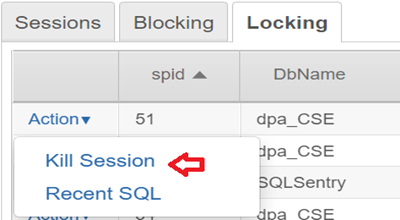
- Click on the Locking or Blocking Tab
- Click on the Action drop down menu and select ‘KILL’
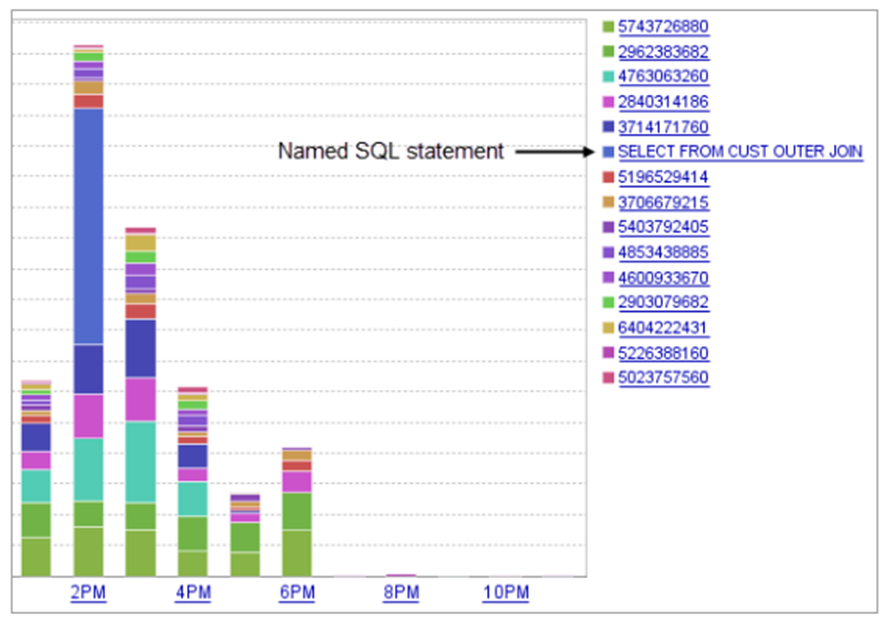
B. Name SQL Statements
- Click to the appropriate server
- In the chart, click on the hash value of choice (on the right side of Top SQL Statements). Note: SQL Statements are identified by hash values, by default
- At the top right, click on SQL Properties
- In the SQL Name field, type the name.
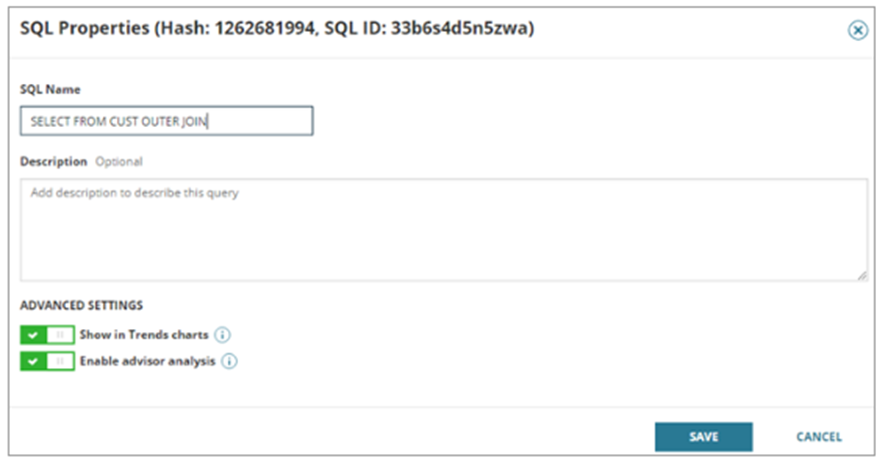
- Click Save
- At the top left of the current page, click back to go to the previous page
C. Create Custom Alerts: There are several custom scripts posted on Thwack that can be used as template.
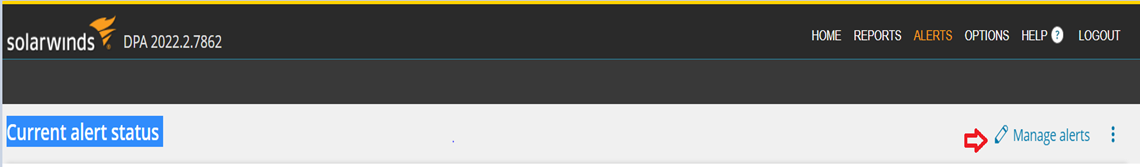
- On the homepage, click Alerts on the top right
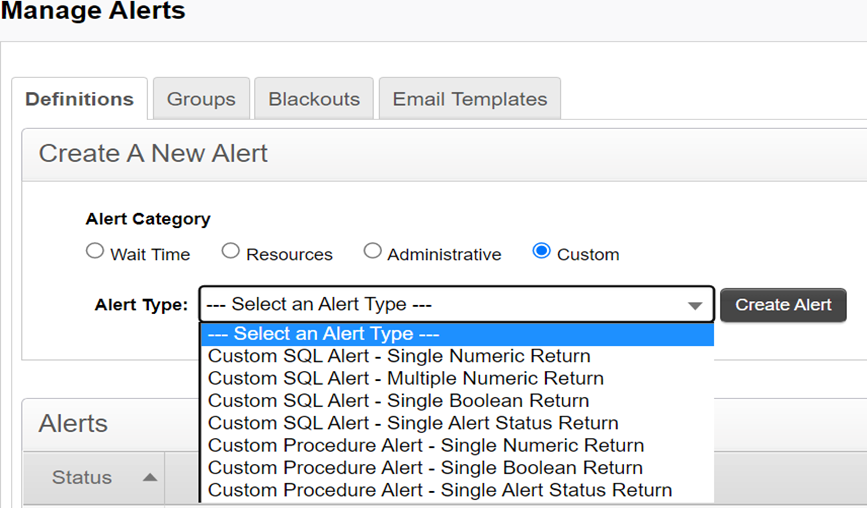
- Click Manage Alerts
- Select Custom as the alert category, select the alert type, and then click Create Alert
- In the Alert Information section:
- Enter a unique name
- To disable the alert, clear the Active checkbox
- Select the execution interval. (DPA recommends an execution interval of at least 10 minutes.)
- Enter the notification text to be sent with the email notification. Include an explanation of the issue and the suggested resolution.
- Specify the database instances to which the alert applies, to execute the SQL query or stored procedure (instead of the DPA repository). Instances that satisfy one or more requirements can be manually chosen or found using a rule.
- DPA uses the rule conditions to determine which instances the alert monitors when you choose a rule. The list of instances automatically updates whenever your environment changes.
- Click Use rule
- The Rules page lists the existing rules
- Select an existing rule, or create a new rule and then select it.
- Clean Assign Rule
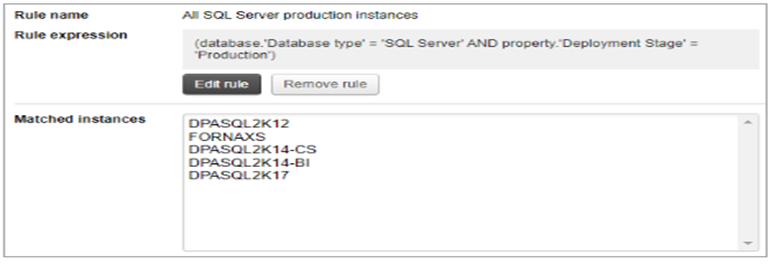
- The alert definition shows the selected rule name, rule expression, and a list of instances that currently meet the rule conditions.
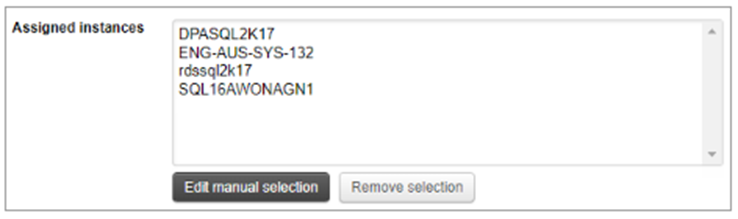
- If you manually select the database instances, the list is static
- Click Select database instances.
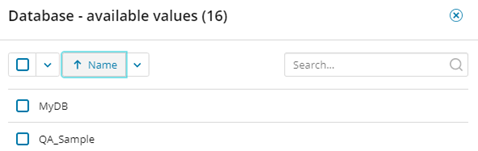
- The available database instances page lists database instances. If the alert type is specific to one type of database, the page lists only instances of that type.
- Use the Search bar to locate instances or apply filters to refine the list
- To select all instances in the list, select the checkbox above the list. To select individual instances, select the checkbox next to each instance.
- Click Assign and go back
- The alert definition shows the list of selected instances.
- In the Alert Parameter section
- Enter the SQL statements to execute or enter a call to a stored procedure. Use custom tags to include variables such as the database ID and to include the required output parameters for stored procedures.
- In the Execute Against drop-down, indicate if the SQL statement or stored procedure should be executed against the selected database instances or against the DPA repository database.
- If the Description field is available, you can enter a custom description for the alert. This description replaces the DPA default description for the alert type when the Description parameter is included in the email template.
- If the alert returns a numeric value, specify the Units for the returned value.
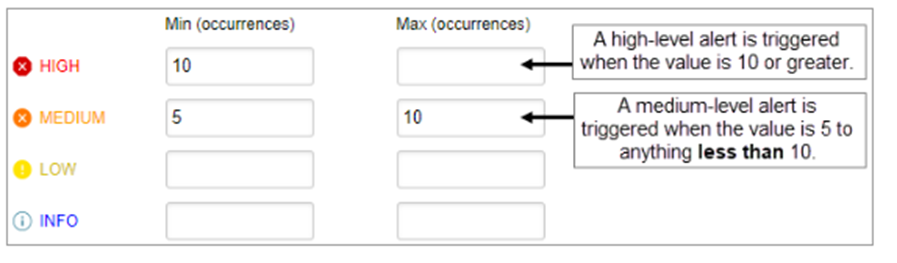
- If the alert returns a numeric value, specify the thresholds for each alert level you want to enable.
- Leave the Max value for the highest-level blank to alert on anything above the minimum value for that level.
- If you configure multiple levels, the Max value for lower levels must equal the Min value for the next higher level.
- When you enter a Max value for a level, DPA alerts at that level when the value is greater than or equal to the Min value but less than the Max level. For example, if the Min value is 5 and the Max value is 10, DPA alerts at that level when the value is 5 or more, but less than 10.
- Select the person or group who gets notified when each alert level is triggered and when the alert is broken. (The alert status is set to Broken if an error occurs during execution). To send notifications when the alert returns to Normal, select a recipient for Normal. To send notifications when the alert returns to Normal, the notification policy must be Notify when level changes.
- Select the email template that defines the contents of the email notifications sent by this alert.
- Click Email Preview to see an example of the email that will be generated using the selected email template and contact information.
- If the alert applies to multiple database instances, select an instance in the Email Preview dialog box and click OK. After reviewing the email, you can select a different database instance or click Cancel to close the Email Preview dialog box. The email sent to users might not exactly match the preview because some alert parameters cannot be evaluated during a preview.
- Click Test Alert to test the alert and view the current alert level. The test does not generate an email
- Click Save.
Additional Resources: Custom Alerts Documentation
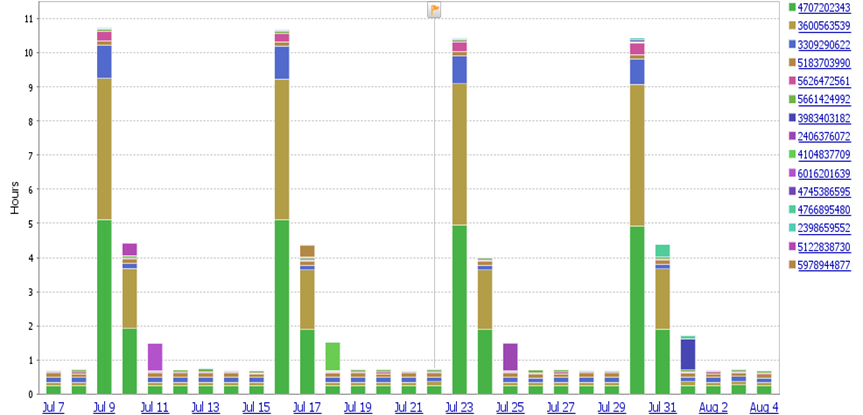
D. Identifying Idle Blockers: Idle Blocking occurs when there is a session opened a transaction (establishing a lock on a resource) and then did not commit or rollback explicitly. The transaction stays open, even though no work is currently being done. To find if there is an idle blocker, take the following steps.
- Navigate to the server that is experiencing slow performance
- Filter by Day
- Scroll down to the bottom of the page
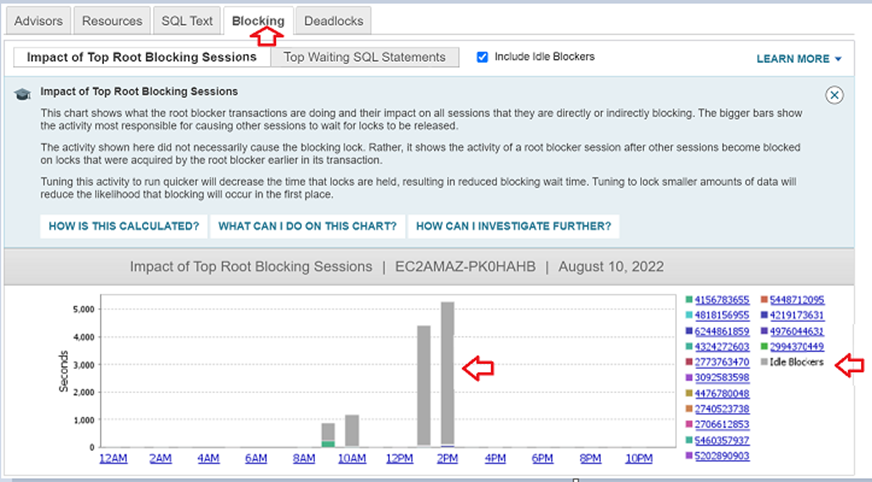
- To investigate, click on the bar or axis label
E. Personalize Resources: Custom Metric Threshold: Resources metrics are used to monitor the health of your databases and to correlate contention for resources with increases in database wait times. Resource metric charts indicate when the metric has exceeded a Warning or Critical threshold. The preset thresholds can be modified to suit your environment's requirements. You can add default thresholds to metrics if they do not already have them. The monitored instances can all be under the defined thresholds or only one specific database instance. Custom threshold can also be saved as a default for all instances by clicking ‘Save as Default’
- To view the current threshold, click the database instance whose resource metric threshold you want to view
- Click on Resource

- Click the tab that displays the metric whose thresholds you want to view or change.
- Locate the metric chart and click on the settings icon to the right of the chart.
- The Resource settings page displays the thresholds that are currently used for this metric.
- To change the threshold, select Custom. If the metric has default threshold, the Custom dialog box initially shows the default values.
- If the metric does not have default thresholds, the Custom dialog box shows the Warning and Critical thresholds as disabled.

- Enter the new threshold values:
- If the metric does not have default thresholds, click the toggle switch next to each threshold level you want to enable.
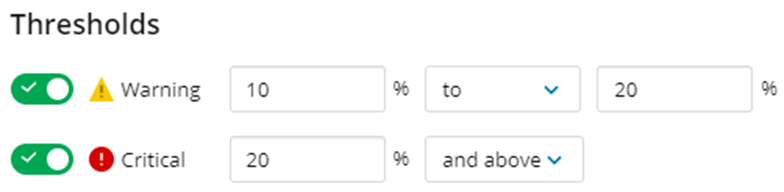
- If you enable both the Warning and Critical threshold levels, enter the same value at the intersection of the two levels:
- For the metrics that alert on higher values, enter the same number as the maximum Warning value and the minimum Critical value.
- DPA issues a Warning alert when the value is within the Warning range (inclusive). DPA issues a Critical alert when the value is greater than the minimum Critical threshold.
- Example: For the thresholds shown in step 1, DPA issues a Warning alert when the value is 10 through 20. DPA issues a Critical alert when the value is greater than 20.
- For metrics that alert on lower values, enter the same number as the minimum Warning value and the maximum Critical value.
- DPA issues a Warning alert when the value is within the Warning range (inclusive). DPA issues a Critical alert when the value is less than the minimum Critical threshold.
- Example: For the thresholds shown below, DPA issues a Warning alert when the value is 90 through 95. DPA issues a Critical alert when the value is less than 90.
- To use the new values only for this database instance, click Save.
- To use the new values for all database instances, click Save As Default.
- When you Save As Default, the new default threshold values are used for all database instances unless custom thresholds have been specified for an instance. Any database instance with custom thresholds will continue to use those thresholds.
Additional Resources: Custom Resource Thresholds
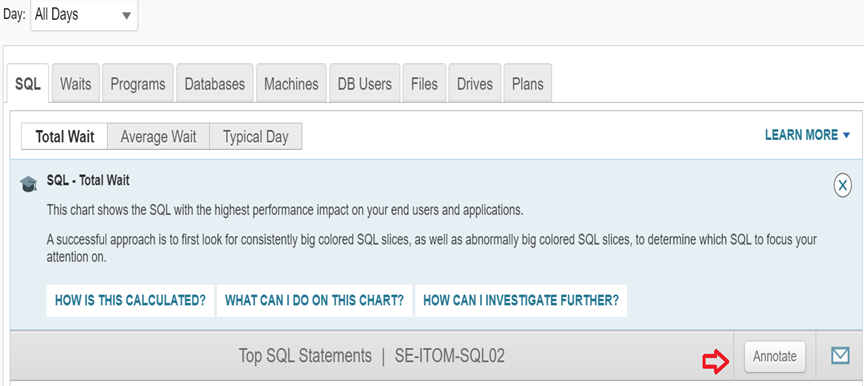
F. Annotations: Annotations are used when you want to make a change that could affect performance (such as adding an index, tuning a query, or adding resources). The annotations are displayed on all trend and time slice charts. By comparing performance data before and after the change, you can see what effect the change had.
- From the DPA home page, click the name of the database instance affected by the change.
- On the top right of the trend chart, click ‘Annotate’.
- Name the annotation, specify when it was added, and provide details about what change was made and why. Click Save. Note: If your DPA server is in a different time zone, enter the DPA server time.
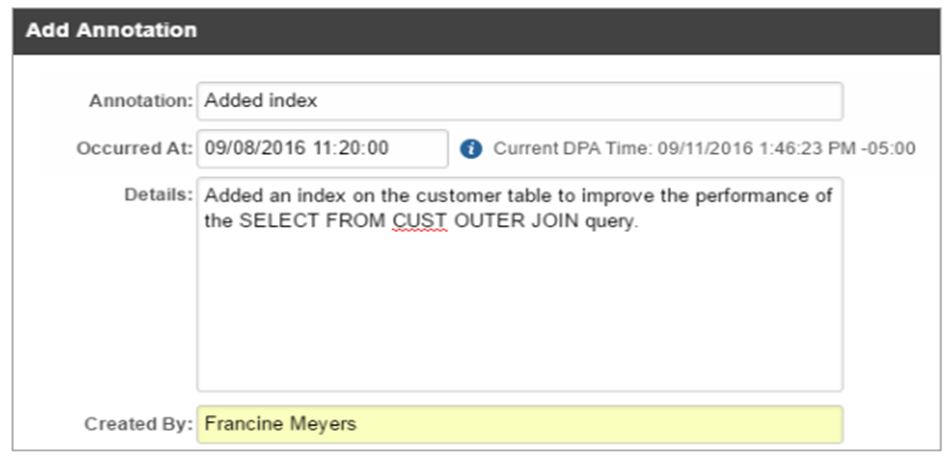
- The annotation is displayed as a flag on the chart. Point to the flag to see a summary or click it to see details.

Additional Resources: Annotations
G. DPA Introduction: In case you missed an overview video when you sign into DPA for the first time, there is a ‘Learn More’ tab located at the top right of the Trends page
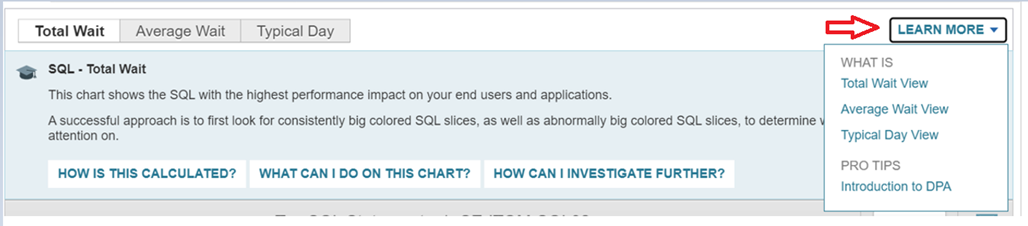
Additional Resources: DPA Basics
H. Find SQL: Find SQL functionality is used to search for any SQL statement based on what you know about it. You can specify a time range and then apply any combination of filters and search strings.
- From the DPA home page, click the name of the database instance you want to search.
- At the top of the page, click Find SQL (if this feature is not enabled for the selected database instance, the page displays a message. You can enable the Find SQL feature for all database instances or for a specific database instance.
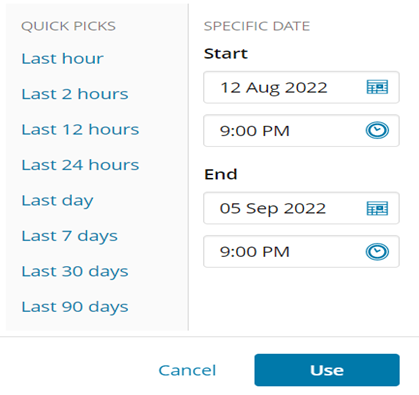
- At the top of the page, you can select the time a predefined time period or enter specific dates (default is 24 hours) and click Search
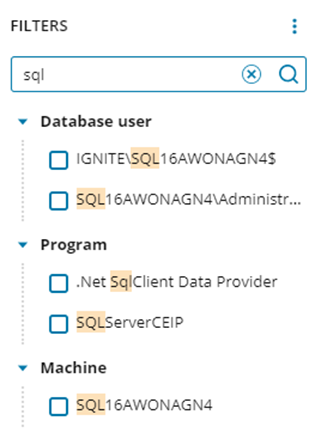
- To apply filters, depending on the database instance selected, some or all the following filter categories are available:

- Database user: The user ID that ran the SQL statement.
- Program: The application that ran the SQL statement.
- Database: The database that the SQL statement queried.
- Machine: The computer from which the SQL statement ran.
- In the top left corner, click Filters
- To search for a value value, enter the search string in the Filters Search field. Only values that include the search string are displayed
- If a filter category includes more than 10 items, click the Show All link.
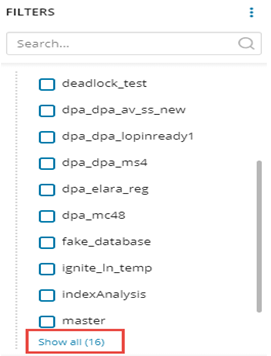
- When the dialog opens, you can page through to view all items, change sort order or search
- Select one or more filters and click Search to apply them.
- The search results include only SQL statements that match all filters. If no search terms are applied with the filters, results are ordered by wait time.
- The applied filters are listed above the Filter button and Search bar.
Note:
- If you are unsure about SQL text, you can apply filters to locate SQL statements that were run by a certain user, as part of a certain application, from a certain computer, or against a specific database.
- If you know something about the SQL text, you can enter search strings such as table names or the operation being performed.
Additional Resources: Find SQL Documentation
I. Create Report Groups: Report groups are used to display data from related reports on the same page. With report groups, you can easily run or schedule multiple reports.
- Click on the appropriate server
- Click ‘Reports’ at the top right of the page
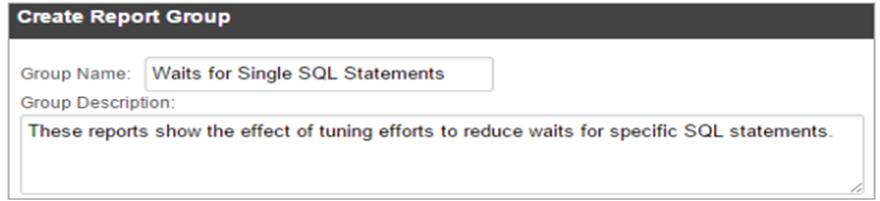
- Click Create Report Group
- Provide a group name and description (although description is optional, it is recommended to provide one)
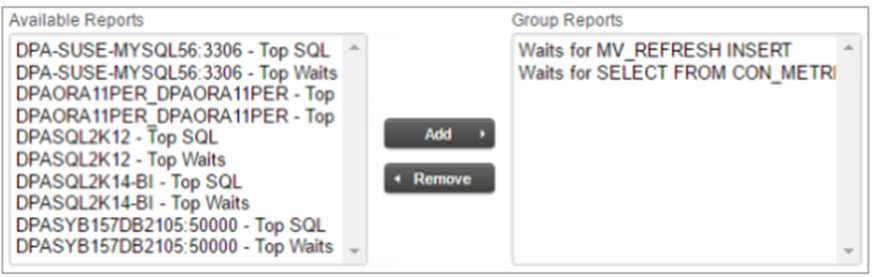
- Select the reports to include in the group and click Add
Additional Resources: Create Report Groups
J. Exclude SQL Statements: It's possible that some lengthy SQL statements won't respond well to tweaking (for example, SQL statements associated with database backups, replication, or data loads). You can omit certain claims from DPA to stop them from taking up Trends charts or producing tuning advice that are ineffective.
Note: If an excluded SQL statement starts affecting database performance, it will not be displayed as an issue in DPA because it was excluded.
- Navigate to the server
- Click the name or hash value that represents the SQL Statement. The Query Details page displays information about the SQL Statement
- In the upper right corner, click SQL Properties
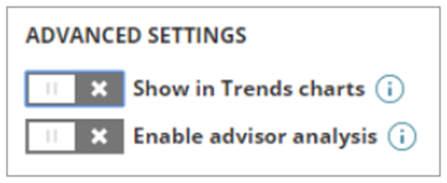
- Under Advanced Settings, clear one or both of the following options:
- Clear the Show in Trends charts setting to remove the SQL statement from multi-day or one-day Trends charts. If you drill in to a time period less than one day, charts include the SQL statement.
- Clear the Enable advisor analysis setting to exclude this statement from the analysis that DPA runs to generate query advisors and table tuning advisors. When analysis is disabled, DPA does not detect problems with the SQL statement. Note: When you clear the Show in Trends charts setting, both options are cleared. DPA does not perform analysis on SQL statements that are not shown in the Trends charts.
Additional Resource: Exclude SQL Statements
K. Central Management: This feature is used to link separate DPA servers together. The Central Server collects information from your remote servers and consolidates the data into a single interface. Each DPA server has its own repository. The Central Server has low overhead and no additional information from the other DPA installations is added to its repository database. The following are situations where DPA Central should be considered:
- The infrastructure resources supporting DPA (for example, storage availability, I/O throughput, RAM, and CPU) reach capacity as the volume of queries being analyzed increases.
- Your monitored instances are distributed geographically, and the network lag time to distant instances is high. You can install separate DPA servers in each location.
- You want to enable separate teams or business units to manage their subset of database instances
Note: SolarWinds recommends configuring DPA Central on a server that is also used to monitor database instances. Having a separate server only for DPA Central is not required.
- Install DPA on a server. This will be your Central Server.
- Log in to that instance as an administrator.
- From the DPA menu in the upper-right corner, click Options.
- Under Administration > Display, click Manage Central.
- Your DPA server should be listed as the Central DPA Server in the list of Registered Servers
- From the DPA menu in the upper-right corner, click Options.
- Under Administration > Display, click Manage Central.
- Click Add Server.
- Enter information about the remote DPA server.
- Click Test connection, and click Save.
- A successful test indicates that DPA can communicate with the remote server through the provider host and port. It does not indicate that DPA can authenticate users.
- If the test fails, check the host name in the Server Name Field. Does it contain an underscore (_) character? An underscore is not valid for host names. If you cannot rename the host, enter the IP address.
- Repeat steps 1- 4 for the remaining remote DPA servers.
Note: The details of your remote DPA servers are not stored in the repository, but in a file on your Central Server, located here:
DPA-install-dir/iwc/tomcat/ignite_config/iwc/central/RemoteRepositories.json
This is a plain-text JSON file. No sensitive data is stored in this file.
Relevant Links:
- Custom Alerts
- Annotation
- Investigate Performance Issues with DPA
- Find SQL
- Resource Custom Threshold
- Exclude SQL Statements
- Create Report Groups
- Set up a Central Server and add remote DPA servers
