Introduction
As IT and Operational Technology (OT) continue to converge, organizations are demanding deeper insights into environments that span industrial systems, edge devices, and traditional IT infrastructure. The rise of the Industrial Internet of Things (IIoT) brings both opportunity and complexity — especially when it comes to observability.
At SolarWinds, we’re taking steps to help customers monitor and optimize their IoT/OT environments. Two critical protocols — MQTT and OPC UA — are central to this transformation. This blog explores how SolarWinds Observability SaaS is evolving to support MQTT and OPC UA, the benefits this brings, and where we go next.
What Is MQTT?
MQTT (Message Queuing Telemetry Transport) is a lightweight, publish-subscribe network protocol ideal for low-bandwidth, high-latency environments. It decouples data producers (publishers) from consumers (subscribers) via a central broker. MQTT is foundational for many IoT use cases due to its minimal footprint and flexible Quality of Service (QoS) guarantees.
Use cases range from smart sensors in manufacturing plants to real-time telemetry in energy systems. Observability into MQTT environments is essential to track performance, detect issues, and understand the health of edge infrastructure.
Native MQTT Monitoring in Solarwinds Observability SaaS
SolarWinds is introducing MQTT support through our OpenTelemetry (OTEL) Collector, allowing visibility into MQTT brokers and sensors.
Supported MQTT Entities
1. MQTT Broker
- What it does: Routes messages between publishers and subscribers.
- Monitored Attributes:
- Name, Protocol (mqtt/mqtts), Address, Port
- Connection Status: OK, Connection Failed, Subscribe Failed, Publish Failed, Roundtrip Failed
- Key Metric: Roundtrip Time — measures time taken from publish to receive.
- Optional Metrics (via
$SYS topics, where supported):- Clients connected
- Active subscriptions
- Broker version
- Bytes/messages received/sent per minute
Note: Some brokers like HiveMQ discourage $SYS topic usage. In such cases, integration via Prometheus exporters or native APIs may be preferable.
2. Custom MQTT Sensor
- What it does: Allows users to define specific MQTT topics and extract custom metrics.
- Monitored Attributes:
- Sensor Name
- Custom Metrics: e.g., Temperature, Humidity, Battery Level
- Format: Raw values or parsed JSON
Implementation Details
The MQTT receiver is embedded in the SolarWinds OTEL Collector, our default monitoring agent. Configuration (e.g., broker connection details and sensor definitions) is handled via the config.yaml.
We also provide reference deployments to simplify rollout.

UI and Experience
We're proposing a new IoT section within the Infrastructure menu of SWO. This section will serve as the entry point for MQTT, and later OPC UA, entities.
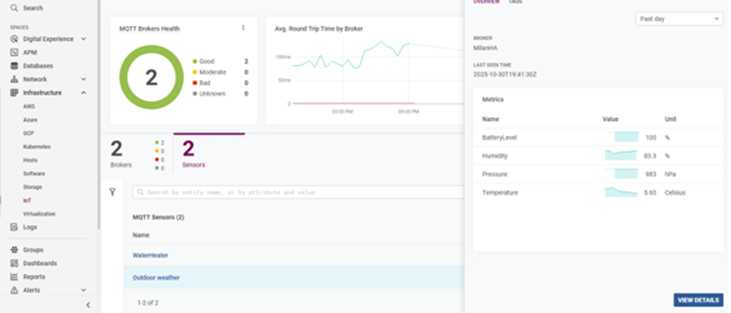
Custom dashboards and widgets (e.g., gauges, trends, status indicators) willoffer rich visualization tailored to IoT/OT data.
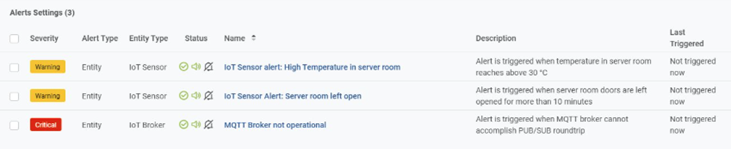
Alerts can be defined over broker and sensor metrics and attributes.
Future Improvements for MQTT Support
- HiveMQ Observability: Native support using Prometheus receivers
- Azure IoT Hub / AWS IoT Core: Monitor using cloud-native APIs
- Custom MQTT Topic Statistics: Track metrics like message rates or payload size per topic
- Event Definition: Trigger alerts based on custom sensor thresholds (e.g., “Room Occupancy Changed”)
- Sparkplug B Support: Standardized, schema-aware MQTT extension for industrial use cases
What Is Sparkplug B?
Sparkplug B builds on MQTT and defines a structured, standardized data model using Protocol Buffers. It adds context, metadata, and lifecycle management (birth/death certificates) to MQTT messages — essential for industrial-scale deployments.
We are exploring use cases to auto-discover Sparkplug entities such as:
- Edge of Network Nodes: Gateways bridging legacy OT with modern MQTT systems
- Devices (EoNDs): Sensors, actuators, or logical groups of industrial data points
OPC UA Monitoring in Solarwinds Observability
Overview
OPC UA (Open Platform Communications Unified Architecture) is a widely adopted protocol in industrial automation and OT environments. It plays a vital role in enabling secure, reliable, and platform-independent data exchange. While OPC UA is part of our strategic roadmap, support is currently in the early exploration phase and not yet available for customer testing.
We’re actively seeking input from users to better understand the use cases and capabilities that would be most valuable. Your feedback will help shape the direction and priorities of our future OPC UA integration.
Try It Out: Feature Preview
Given the emerging nature of MQTT and OPC UA support, these features will be released as experimental/preview.
If you are Interested in exploring IoT/OT observability with SolarWinds you connect with us to enable a preview of these features in your tenant:
We’ll help you get started with MQTT monitoring — including entity setup, dashboards, and example configurations.
Note: OPC UA is not yet available for testing. However, we are actively collecting feedback on desired use cases and capabilities. If you have input to share, we’d love to hear from you.
Don’t have a SaaS tenant yet? Click here to start your 30-day free trial.
Final Thoughts
The convergence of IT and OT is no longer a future trend — it’s happening now. With the introduction of MQTT support and plans for OPC UA, SolarWinds Observability is evolving into a comprehensive platform for both traditional IT infrastructure and the industrial environments powering modern operations.
While MQTT is available for early testing, OPC UA remains in the feedback phase. Together, these efforts lay the groundwork for full-stack visibility — from sensors to servers, from factory floors to cloud workloads.

