We have a group of nodes that will hit 100% CPU for quite sometime and causes issues in processing. I wanted to add a widget to one of my dashboards that will list the Nodes that have had CPU over 98% for 30 mins or more.
I use this SWQL and get three nodes
SELECT
n.NodeID,
n.Caption AS NodeName,
AVG(c.AvgLoad) AS AvgCPU
FROM
Orion.Nodes n
JOIN
Orion.CPULoad c ON n.NodeID = c.NodeID
WHERE
c.DateTime >= GETDATE() - 0.0208 -- Last 30 minutes (0.0208 days)
GROUP BY
n.NodeID, n.Caption
HAVING
AVG(c.AvgLoad) >= 98.0
I use this SWQL and get one node
SELECT
v.VirtualMachineID,
v.Name AS VM_Name,
AVG(c.AvgLoad) AS AvgCPU
FROM
Orion.VIM.VirtualMachines v
JOIN
Orion.CPULoad c ON v.NodeID = c.NodeID
WHERE
c.DateTime >= GETDATE() - 0.0208 -- Last 30 minutes
GROUP BY
v.VirtualMachineID, v.Name
HAVING
AVG(c.AvgLoad) >= 98.0
Then I went to a report to see if I could get CPU out of this.
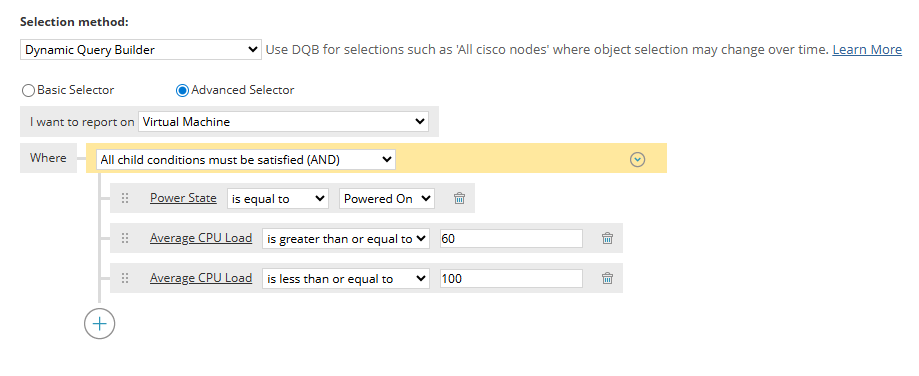
It looks like I am doing something wrong. I am still learning the SWQL side of things. So any help or pointing in the right direction would be appreciated. Thanks! Dave