We’re excited to announce a release candidate (RC) for version 2025.4 of the SolarWinds® Platform, SolarWinds® Observability Self-Hosted, and the Network and Systems modules. Version 2025.4 RC is now available for all customers under maintenance, so log in to your customer portal to download it. Want to see everything new? Check out the Release Notes.
Here is a quick list of all the major features with more detailed information below. Highlighted items are your favorite requests!
Observability Self-Hosted Exclusives
Observability Self-Hosted, Network, and Infrastructure Modules
- SD-WAN: Cisco cEdge Support
- SD-WAN: Fortinet Tunnel Monitoring via FortiManager
- Firewalls: FortiGate and Cisco Firepower (SNMP)
- EOS/EOL data for Palo Alto
SolarWinds Platform (available to all products)
- Dark Theme for all Modern Dashboards
- Improvements to Recurring Maintenance Windows
- Increased Additional Web Servers (AWS) scalability
- HA Repair and HA Role Change (OSH Only)
- Intelligent Maps improvements
- Windows Polling: gMSA/WinRM support for UDT
- Performance Improvements
- Improved IPv6 support and 508 compliance
Observability Self-Hosted Exclusives
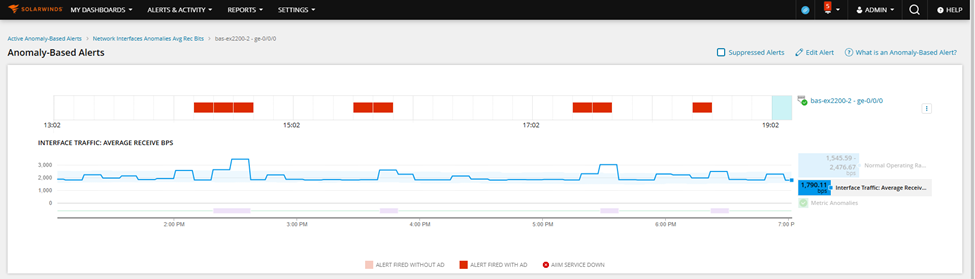
Anomaly Based Alerts for Interfaces
We’ve added support for interfaces to Anomaly Based Alerts, allowing you to combine anomalous behavior detection with thresholds, just like many other metrics. Watch the amount, errors and discards of inbound and outbound traffic for anomalies and alert when there is an issue. Visualize the normal operating range of your interface with your current performance.
Monitor Proxmox Virtual Environment
In this version we are introducing basic support for Proxmox Virtual Environment hypervisor. After adding your Proxmox environment to the platform, you will be able to monitor clusters, hosts and VMs for performance and capacity issues. Proxmox information will behave just like other hypervisors, so all the views, alerts, reports, etc. are there!
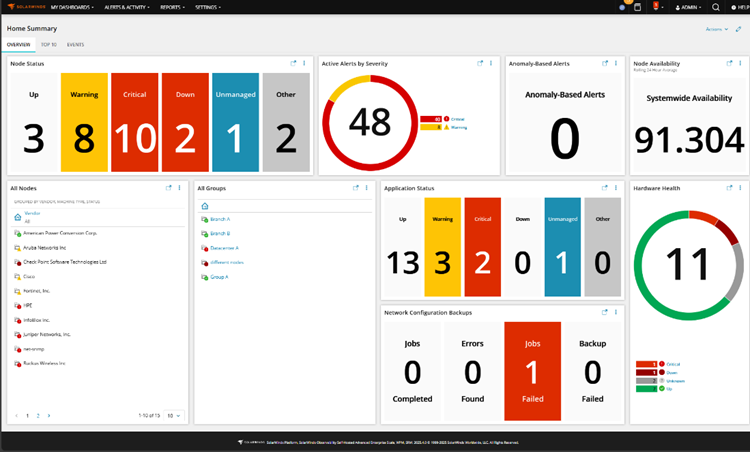
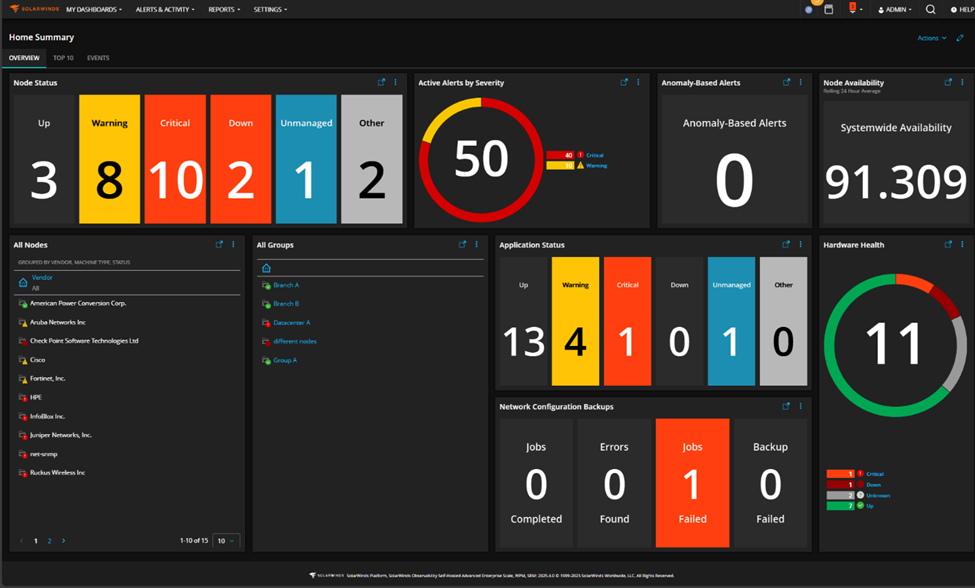
New Home Summary Page
We’ve built a new home summary page from the ground up using modern dashboards. This will be the default landing page for new installs. Existing customers with OSH will have an option to switch to it. It includes key aspects from several areas of the product and additional tabs with more insights.
It also comes with a new Modern Dashboard widget specifically designed to drill into your data for easier navigation and investigation without leaving the page. This new widget is called the Entity Drill Down Widget and is available for flavors of licensing of the SolarWinds Platform.
Integration with multiple SEM servers
You can now connect all your Security Event Management (SEM) instances to a single, centralized dashboard. This feature aggregates your deployments into a unified table, providing a high-level cumulative overview of your security events across your environment. From this central hub, you can quickly launch into any individual SEM console for deeper analysis.
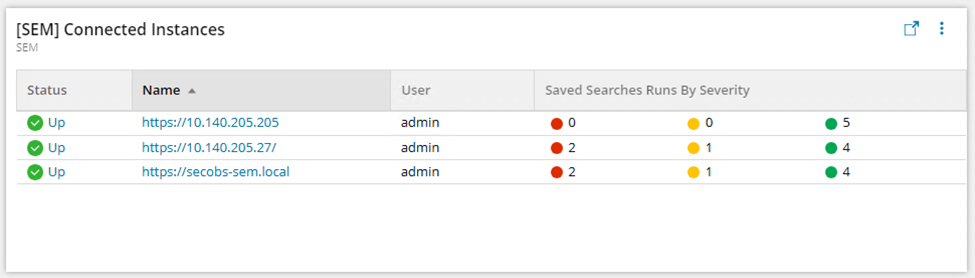
It's ideal for organizations with multiple SEM deployments and Managed Service Providers (MSPs) with multiple SEM customers looking to streamline operations.
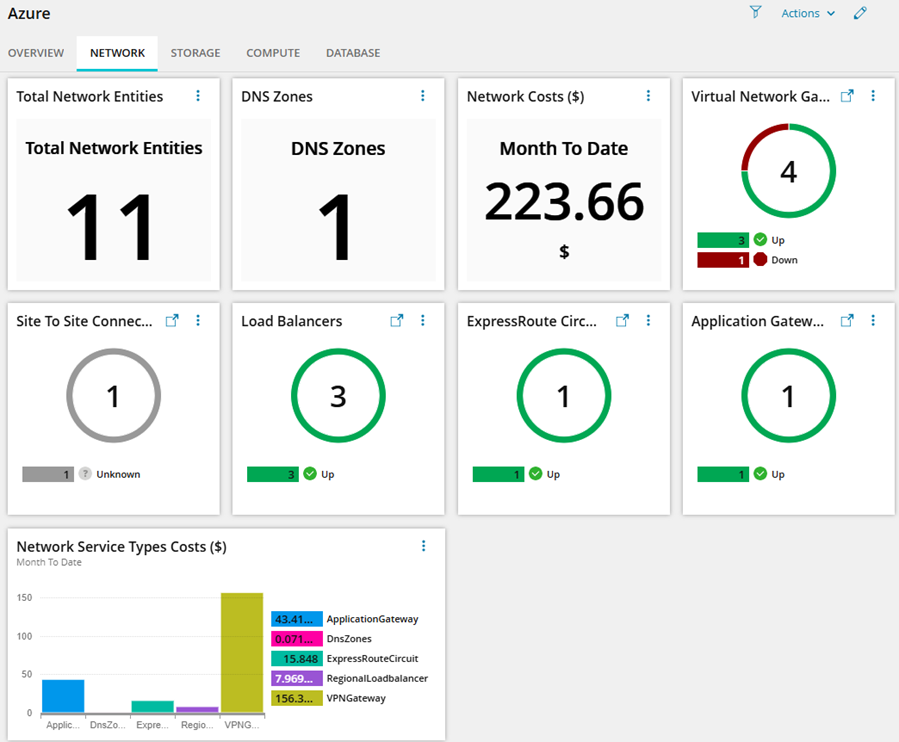
Track cloud costs for monitored entities (Azure, AWS)
In this release, we are introducing a new feature that allows users to track costs for using Azure and AWS cloud services. Cloud cost monitoring provides users with clear information about the overall costs of cloud services monitored by Observability Self-Hosted, as well as structured costs for individual network, compute, storage and database entities. Gain a centralized view of Azure / AWS spending to track, forecast, and optimize costs without leaving SolarWinds Observability. Identify cost spikes and underutilized resources early to reduce waste and improve budgeting accuracy.
Expanding GCP Coverage
In the continued expansion of GCP coverage, we’ve added several new entities in this release. Customers can add these new entities in the cloud wizard, each new entity will consume one license, and they will appear appropriately in all dashboards, reports and alerts.
- Cloud Storage
- Cloud SQL
- DNS
- Site-to-Site VPN
Also, we've made it easy to apply additional monitoring to a Google VM - just a single click, pick the type of monitoring you want (Agent, SNMP or WMI) and go!
Expanding Azure Coverage
- Azure Kubernetes Service - Monitor AKS cluster health, performance, and resource usage
- CosmosDB - Track key performance metrics like throughput, latency, and request rates
Expanding AWS Coverage
- Organizational Credentials - manage multiple AWS accounts under one umbrella as it enables centralized monitoring from all member accounts. Simplify multi-account AWS monitoring by connecting entire organization with a single set of secure credentials. In this release, a limited set of metrics for individual monitored services will be available when using organizational account.
- DynamoDB - monitor the NoSQL database, including table throughput, latency, and errors.
Support SwitchStack monitoring for Aruba
We are extending multi-vendor coverage with support for Aruba switch stacks, providing visibility into stack topology, member health, and redundancy. With this release, you can view stack topology, member roles, uptime, and ring redundancy, and also monitor hardware health across all members. The platform detects stack membership changes, ring failures, and hardware faults in real time.
The new Switch Stack view shows details such as model, serial number, CPU/RAM utilization, and member status.


APE Adaptive Scaling
For large environments, Additional Polling Engines will now scale with the amount of resources given to it, so more CPU and memory mean more polling capacity, allowing you to reduce the number of pollers deployed in your environment. Documentation will be updated with details by GA (October).
Observability Self-Hosted, Network, and Infrastructure Modules
SD-WAN: Cisco cEdge Support
We are extending our SD-WAN coverage with Cisco Catalyst SD-WAN (cEdge) monitoring via the vManage API. With this release, you can view orchestrator status, edge device inventory, and uplink health, and also monitoring VPN tunnel performance. The platform provides visibility into key metrics such as latency, jitter, and packet loss for every tunnel, helping you quickly identify degraded links.
From the orchestrator dashboard, you can:
- View orchestrator health and API polling status.
- Track WAN uplinks with real-time interface status, IP addresses, and service provider context.
- Monitor edge devices, including model, serial, and location.
- Analyze VPN tunnels with tunnel state, traffic paths, and performance metrics.
- Visualize the entire SD-WAN topology in a single map
SD-WAN: Fortinet Tunnel Monitoring via FortiManager
Support for Fortinet SD-WAN monitoring was introduced in the 2024.4 release, providing visibility into FortiManager-managed devices. While that initial release focused on device-level monitoring, tunnel-level metrics were not yet available. With this release, we’ve extended support to include VPN tunnel monitoring, giving you the visibility you need into your Fortinet SD-WAN environment. You can now view the full list of tunnels, check their status, and track key performance metrics such as jitter, latency, and packet loss.
Firewalls: FortiGate and Cisco Firepower (SNMP)
We are enhancing SNMP-based monitoring for FortiGate and Cisco Firepower firewalls, delivering expanded visibility into Site-to-Site VPNs and Remote Access VPNs (IPsec & SSL). With this release, you can monitor tunnel health and track remote access usage directly in the platform.
For Site-to-Site VPNs, the new view displays local and remote peer IPs, tunnel uptime, status, and throughput. You can also view the encryption and hashing algorithms negotiated during Phase 1 (IKE) and Phase 2 (IPsec), providing insight into tunnel security configurations.
For Remote Access VPNs, the new panel highlights active sessions, including assigned local IPs, source IPs, and VPN type (IPsec or SSL). You can track traffic metrics, session durations, and overall client load, making it easier to identify usage spikes and troubleshoot remote connectivity issues.
EOS/EOL data for Palo Alto
Now see End of Support and End of Life data for Palo Alto inside of your Network Configuration space. This will pull EoS/EoL data for Palo Alto automatically. We also significantly improved the speed of fetching and processing this data for all supported vendors.
SolarWinds Platform (available to all products)
Dark Theme for all Modern Dashboards
You can now view modern dashboards in dark theme without needing to enter NOC mode. You can edit your user profile settings to set your preferred theme. All Modern Dashboard pages will follow this setting. Navigate to the top right corner and click on your username and select Profile and you’ll see the theme preference
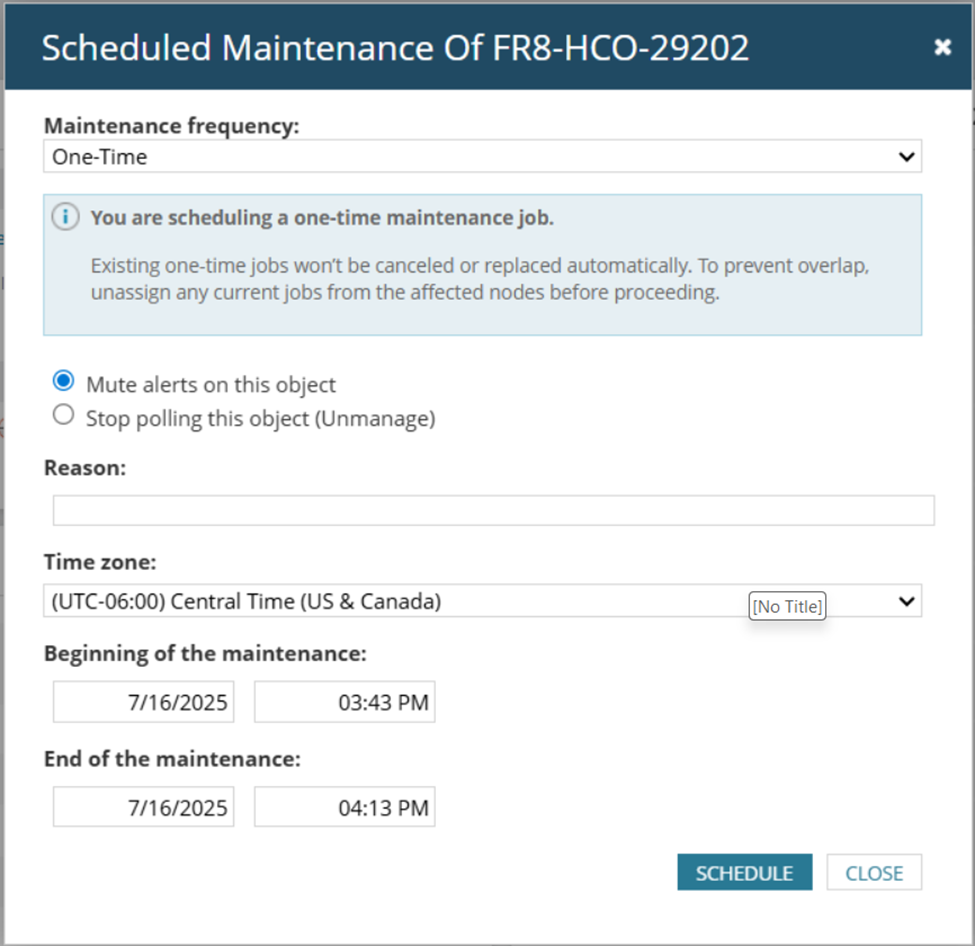
Improved Recurring Maintenance Windows
Recurring maintenance windows is a new feature that we are continuing to improve:
Node details pages have a new widget that show you the schedules associated with the node that will execute in the next 30 days.
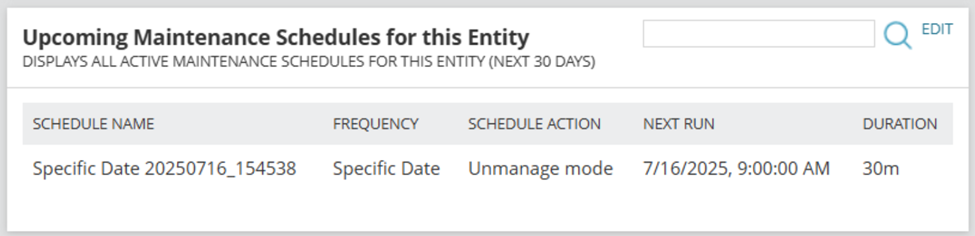
When adding a One-Time maintenance window, you can now add a reason. Also, when adding a new One-Time maintenance window, it doesn’t delete the previous one. One-Time maintenance windows will show in the new Maintenance window widget.
HA Repair and HA Role Change
HA Repair: If you use HA and have ever needed to contact support to fix it, you no longer need to do so. Within the HA Pool tab under My Deployment, we’ve added a repair button to simplify this process. Using this option will analyze the state of the HA Pool and attempt to automatically repair any issues that it detects.
HA Role Change (OSH Only): With the ability to add more than two servers to an HA Pool, customers can now have a many to many ratio of active to standby servers. In previous releases, if you needed to change this ratio it required a reinstallation of that server to select the appropriate HA role. This can now be done in the Web Console without any reinstallation. You can do this by editing an HA Pool and selecting the change role button. To move an active server into a standby role, all entities must be reassigned to another engine beforehand.
Intelligent Maps improvements
More improvements to maps to increase usability and are another step move another step closer towards Network Atlas parity.
- Assign a single interface to a line
- Visible connections to shape or entity when moving labels
- Selectively add or remove connection pills
- New alignment menu with complete object alignment options
- Ability to add multiple labels for shapes
- Edit line width for lines and connections
- Support for underline in text boxes and labels
- New labels will appear arranged around shape or entity instead of overlapping
Note that Network Atlas is deprecated and will be retired in the near future. Continuing to use Network Atlas maps in your instance prevent you from moving to 64-bit IIS.
WPM EoL for Internet Explorer and macOS technology
Internet Explorer-based transactions in Web Performance Monitor (WPM) have been removed from the product. You will not be able to update to 2025.4 if there are any IE transactions remaining. More information is available here.
Also note that the macOS based web transaction recorder has been removed from the product.
And the rest…
Here are more improvements in this release:
- Additional Web Servers doubles scalability, now supports 100 concurrent users
- gMSA/WinRM support for UDT
- Improved IPv6 support and 508 compliance
- Performance Improvements
- Security and bug fixes
Security Always
We focus on securely coding, building, and delivering software to you. SolarWinds Aims to Set New Standard in Software Development with Next-Generation Build System. Our choices in forging the SolarWinds Platform align with our Secure by Design philosophy, enhancing our ability to execute this vision now and in the future.
How to Download
The 2025.4 release candidate is a fully tested and supported version and is ready to install on a new server or update your current one.
To see everything included in the release, check out the Release Notes.
Not Quite Ready for the Release Candidate?
If you aren’t ready to upgrade to the Release Candidate, a 2025.2.1 Service Release is available – see the 2025.2.1 Release Notes for all the details.
What’s Next?
The 2025.4 release of the platform and products is another step forward, but there is always more to do. Check out our What We’re Working On post for what’s coming next for the SolarWinds Self-Hosted platform and products.
—The Observability Self-Hosted Team