Tuning the Java Virtual Machine (JVM) is essential for squeezing the best performance out of your applications. It helps reduce latency, optimize memory usage, and better use your hardware. But to tune the JVM effectively, you need to know what’s happening inside it, especially around garbage collection, memory usage, and threads.
That’s where OpenTelemetry (OTel) comes in. As a vendor-neutral observability framework, OpenTelemetry gives you direct visibility into the internals of your application, including the JVM. You can collect and export runtime metrics with minimal overhead and use them to pinpoint performance issues.
In this post, we’ll show you how to use OpenTelemetry metrics to monitor garbage collection, memory usage, and thread performance in your Java application. Plus, we’ll explain how to export those metrics to SolarWinds Observability SaaS for easy visualization and alerting.
Initial Setup
For this walkthrough, we’re using a sample Java application that simulates JVM load through a thread pool processing memory-intensive tasks. The demo app creates memory and CPU load by processing tasks with random memory allocation (100KB–1MB) and execution time (50ms–150ms) across four worker threads, making it ideal for surfacing real JVM behavior under variable load, such as garbage collection activity and thread utilization. You can try it yourself using the demo in this GitHub repository.
Before we get started, here’s what you’ll need to follow along:
- Java 11 or later: The SolarWinds agent supports Java 8 through Java 21 (check the official documentation for the latest version support).
- A Java application running on the JVM: This can be any Java app you’re currently running or testing, or you can try it out with the demo used in this guide.
- A SolarWinds Observability SaaS account: You’ll be sending metrics from your app to this platform.
Familiarity with JVM startup options and environment variables: You’ll need to modify startup flags to enable the agent and set configuration.
Get SolarWinds Observability SaaS OTel Endpoint and API Token
As mentioned above, we will instrument our application with OTel and send our metrics to SolarWinds Observability SaaS. To do this, you will need to find your OTel endpoint and create an API token for data ingestion. Follow these steps.
Log in to SolarWinds Observability SaaS. Take note of the URL. It may look similar to this:
<span style="font-weight:400;">https://my.na-01.cloud.solarwinds.com/</span>
<span style="font-family:'courier new', courier;"></span>
The <span style="font-weight:400;">xx-yy</span> part of the URL (in the above example, that's <span style="font-weight:400;">na-01</span>) indicates the data center for your organization. You will need this when determining your OTel endpoint.
Navigate to Settings > API Tokens.
<span style="font-family:'courier new', courier;"><img style="max-height:615px;max-width:820px;" alt=" " src="https://us.v-cdn.net/6038570/uploads/communityserver-blogs-components-weblogfiles/00/00/00/00/69/4743.pastedimage1749662642476v1.png" /></span>
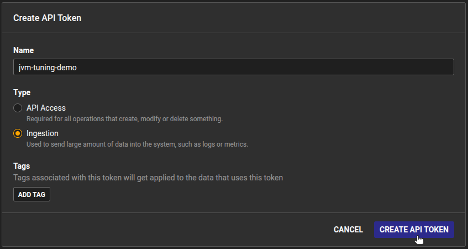
On the API Tokens page, click Create API Token.

Specify a name for your new API token. Select Ingestion as the token type. You can also add tags if you wish. Click Create API Token.
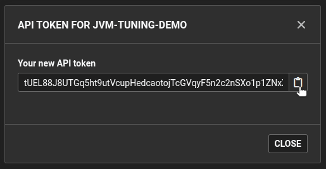
Copy the resulting token value.
Configure the Application for OpenTelemetry Instrumentation
Before instrumenting your application, you will need to add the appropriate configurations and dependencies.
Add OpenTelemetry Dependencies
First, edit pom.xml to add the necessary dependencies:
<span style="font-weight:400;"><</span><span style="font-weight:400;">dependency</span><span style="font-weight:400;">></span><span style="font-weight:400;"><br /></span><span style="font-weight:400;"> <</span><span style="font-weight:400;">groupId</span><span style="font-weight:400;">>io.opentelemetry</</span><span style="font-weight:400;">groupId</span><span style="font-weight:400;">></span><span style="font-weight:400;"><br /></span><span style="font-weight:400;"> <</span><span style="font-weight:400;">artifactId</span><span style="font-weight:400;">>opentelemetry-api</</span><span style="font-weight:400;">artifactId</span><span style="font-weight:400;">></span><span style="font-weight:400;"><br /></span><span style="font-weight:400;"> <</span><span style="font-weight:400;">version</span><span style="font-weight:400;">>1.26.0</</span><span style="font-weight:400;">version</span><span style="font-weight:400;">></span><span style="font-weight:400;"><br /></span><span style="font-weight:400;"></</span><span style="font-weight:400;">dependency</span><span style="font-weight:400;">></span><span style="font-weight:400;"><br /></span><span style="font-weight:400;"><</span><span style="font-weight:400;">dependency</span><span style="font-weight:400;">></span><span style="font-weight:400;"><br /></span><span style="font-weight:400;"> <</span><span style="font-weight:400;">groupId</span><span style="font-weight:400;">>io.opentelemetry</</span><span style="font-weight:400;">groupId</span><span style="font-weight:400;">></span><span style="font-weight:400;"><br /></span><span style="font-weight:400;"> <</span><span style="font-weight:400;">artifactId</span><span style="font-weight:400;">>opentelemetry-sdk</</span><span style="font-weight:400;">artifactId</span><span style="font-weight:400;">></span><span style="font-weight:400;"><br /></span><span style="font-weight:400;"> <</span><span style="font-weight:400;">version</span><span style="font-weight:400;">>1.26.0</</span><span style="font-weight:400;">version</span><span style="font-weight:400;">></span><span style="font-weight:400;"><br /></span><span style="font-weight:400;"></</span><span style="font-weight:400;">dependency</span><span style="font-weight:400;">></span><span style="font-weight:400;"><br /></span><span style="font-weight:400;"><</span><span style="font-weight:400;">dependency</span><span style="font-weight:400;">></span><span style="font-weight:400;"><br /></span><span style="font-weight:400;"> <</span><span style="font-weight:400;">groupId</span><span style="font-weight:400;">>io.opentelemetry</</span><span style="font-weight:400;">groupId</span><span style="font-weight:400;">></span><span style="font-weight:400;"><br /></span><span style="font-weight:400;"> <</span><span style="font-weight:400;">artifactId</span><span style="font-weight:400;">>opentelemetry-exporter-otlp</</span><span style="font-weight:400;">artifactId</span><span style="font-weight:400;">></span><span style="font-weight:400;"><br /></span><span style="font-weight:400;"> <</span><span style="font-weight:400;">version</span><span style="font-weight:400;">>1.26.0</</span><span style="font-weight:400;">version</span><span style="font-weight:400;">></span><span style="font-weight:400;"><br /></span><span style="font-weight:400;"></</span><span style="font-weight:400;">dependency</span><span style="font-weight:400;">></span><span style="font-weight:400;"><br /></span><span style="font-weight:400;"><</span><span style="font-weight:400;">dependency</span><span style="font-weight:400;">></span><span style="font-weight:400;"><br /></span><span style="font-weight:400;"> <</span><span style="font-weight:400;">groupId</span><span style="font-weight:400;">>io.opentelemetry.instrumentation</</span><span style="font-weight:400;">groupId</span><span style="font-weight:400;">></span><span style="font-weight:400;"><br /></span><span style="font-weight:400;"> <</span><span style="font-weight:400;">artifactId</span><span style="font-weight:400;">>opentelemetry-instrumentation-api</</span><span style="font-weight:400;">artifactId</span><span style="font-weight:400;">></span><span style="font-weight:400;"><br /></span><span style="font-weight:400;"> <</span><span style="font-weight:400;">version</span><span style="font-weight:400;">>1.26.0</</span><span style="font-weight:400;">version</span><span style="font-weight:400;">></span><span style="font-weight:400;"><br /></span><span style="font-weight:400;"></</span><span style="font-weight:400;">dependency</span><span style="font-weight:400;">></span><span style="font-weight:400;"><br /></span><span style="font-weight:400;"><</span><span style="font-weight:400;">dependency</span><span style="font-weight:400;">></span><span style="font-weight:400;"><br /></span><span style="font-weight:400;"> <</span><span style="font-weight:400;">groupId</span><span style="font-weight:400;">>io.opentelemetry.instrumentation</</span><span style="font-weight:400;">groupId</span><span style="font-weight:400;">></span><span style="font-weight:400;"><br /></span><span style="font-weight:400;"> <</span><span style="font-weight:400;">artifactId</span><span style="font-weight:400;">>opentelemetry-instrumentation-api-semconv</</span><span style="font-weight:400;">artifactId</span><span style="font-weight:400;">></span><span style="font-weight:400;"><br /></span><span style="font-weight:400;"> <</span><span style="font-weight:400;">version</span><span style="font-weight:400;">>1.26.0-alpha</</span><span style="font-weight:400;">version</span><span style="font-weight:400;">></span><span style="font-weight:400;"><br /></span><span style="font-weight:400;"></</span><span style="font-weight:400;">dependency</span><span style="font-weight:400;">></span><span style="font-weight:400;"><br /></span><span style="font-weight:400;"><</span><span style="font-weight:400;">dependency</span><span style="font-weight:400;">></span><span style="font-weight:400;"><br /></span><span style="font-weight:400;"> <</span><span style="font-weight:400;">groupId</span><span style="font-weight:400;">>io.opentelemetry.instrumentation</</span><span style="font-weight:400;">groupId</span><span style="font-weight:400;">></span><span style="font-weight:400;"><br /></span><span style="font-weight:400;"> <</span><span style="font-weight:400;">artifactId</span><span style="font-weight:400;">>opentelemetry-runtime-metrics</</span><span style="font-weight:400;">artifactId</span><span style="font-weight:400;">></span><span style="font-weight:400;"><br /></span><span style="font-weight:400;"> <</span><span style="font-weight:400;">version</span><span style="font-weight:400;">>1.26.0-alpha</</span><span style="font-weight:400;">version</span><span style="font-weight:400;">></span><span style="font-weight:400;"><br /></span><span style="font-weight:400;"></</span><span style="font-weight:400;">dependency</span><span style="font-weight:400;">></span>
</code></span></p><h3 id="mcetoc_1itg1gn9b4"><a id="Configure_OpenTelemetry_to_Export_Data_to_SolarWinds_Observability_SaaS" name="Configure_OpenTelemetry_to_Export_Data_to_SolarWinds_Observability_SaaS"></a>Configure OpenTelemetry to Export Data to SolarWinds Observability SaaS</h3><p>Next, create a configuration class to set up OTel with authentication and the endpoint for SolarWinds Observability SaaS.</p><p><span style="background-color:#fff0cf;"><code>// src/main/java/com/solarwinds/jvmmonitoring/OpenTelemetryConfig.java
package com.solarwinds.jvmmonitoring;
import io.opentelemetry.api.OpenTelemetry;
import io.opentelemetry.api.common.Attributes;
import io.opentelemetry.exporter.otlp.metrics.OtlpGrpcMetricExporter;
import io.opentelemetry.sdk.OpenTelemetrySdk;
import io.opentelemetry.sdk.metrics.SdkMeterProvider;
import io.opentelemetry.sdk.metrics.export.PeriodicMetricReader;
import io.opentelemetry.sdk.resources.Resource;
import io.opentelemetry.semconv.resource.attributes.ResourceAttributes;
import io.opentelemetry.instrumentation.runtimemetrics.BufferPools;
import io.opentelemetry.instrumentation.runtimemetrics.Classes;
import io.opentelemetry.instrumentation.runtimemetrics.Cpu;
import io.opentelemetry.instrumentation.runtimemetrics.GarbageCollector;
import io.opentelemetry.instrumentation.runtimemetrics.MemoryPools;
import io.opentelemetry.instrumentation.runtimemetrics.Threads;
public class OpenTelemetryConfig {
private static final String SERVICE_NAME = "jvm-monitoring-demo";
private static final String ENDPOINT = System.getenv().getOrDefault("OTLP_ENDPOINT", ""); // Blank default
private static final String API_TOKEN = System.getenv().getOrDefault("OTLP_INGESTION_TOKEN", ""); // Blank default
public static OpenTelemetry initialize() {
// CONFIGURE THE OTLP METRIC EXPORTER
OtlpGrpcMetricExporter metricExporter = OtlpGrpcMetricExporter.builder()
.setEndpoint(ENDPOINT)
.addHeader("authorization", "Bearer " + API_TOKEN)
.build();
// SET UP THE SDK WITH THE EXPORTER
Resource resource = Resource.getDefault()
.merge(Resource.create(Attributes.of(
ResourceAttributes.SERVICE_NAME, SERVICE_NAME,
ResourceAttributes.SERVICE_VERSION, "1.0.0"
)));
SdkMeterProvider sdkMeterProvider = SdkMeterProvider.builder()
.setResource(resource)
.registerMetricReader(PeriodicMetricReader.builder(metricExporter).build())
.build();
// INITIALIZE THE OPENTELEMETRY SDK WITH JUST METRICS
OpenTelemetrySdk openTelemetry = OpenTelemetrySdk.builder()
.setMeterProvider(sdkMeterProvider)
.build();
// REGISTER RUNTIME METRICS
BufferPools.registerObservers(openTelemetry);
Classes.registerObservers(openTelemetry);
Cpu.registerObservers(openTelemetry);
GarbageCollector.registerObservers(openTelemetry);
MemoryPools.registerObservers(openTelemetry);
Threads.registerObservers(openTelemetry);
return openTelemetry;
}
}
Notice that this configuration expects you to set two environment variables at runtime. These are related to your SolarWinds Observability SaaS endpoint.
OTLP_ENDPOINT is the HTTP endpoint URL for OTLP ingestion with SolarWinds Observability SaaS. It will look like https://otel.collector.<strong>xx-yy</strong>.cloud.solarwinds.com:443, but you should replace xx-yy with your specific data center code (such as na-01).- OTLP_INGESTION_TOKEN is the value of the API token created in the previous step.
Instrumenting the JVM
With your application configured to send OTel data to SolarWinds Observability SaaS, you can instrument it to capture important metrics. The updated TaskProcessingSystem class looks like this:
<span style="background-color:#fff0cf;">package com.solarwinds.jvmmonitoring;</span>
<span style="background-color:#fff0cf;">// IMPORT OTEL-RELATED DEPENDENCIES</span>
<span style="background-color:#fff0cf;">import io.opentelemetry.api.OpenTelemetry;</span>
<span style="background-color:#fff0cf;">import io.opentelemetry.api.metrics.LongCounter;</span>
<span style="background-color:#fff0cf;">import io.opentelemetry.api.metrics.Meter;</span>
<span style="background-color:#fff0cf;">import org.slf4j.Logger;</span>
<span style="background-color:#fff0cf;">import org.slf4j.LoggerFactory;</span>
<span style="background-color:#fff0cf;">import java.util.concurrent.*;</span>
<span style="background-color:#fff0cf;">import java.util.concurrent.atomic.AtomicBoolean;</span>
<span style="background-color:#fff0cf;">public class TaskProcessingSystem {</span>
<span style="background-color:#fff0cf;"> private static final Logger logger = </span>
<span style="background-color:#fff0cf;"> LoggerFactory.getLogger(TaskProcessingSystem.class);</span>
<span style="background-color:#fff0cf;"> private static final int NUM_THREADS = 4;</span>
<span style="background-color:#fff0cf;"> private static final int SHUTDOWN_TIMEOUT_SECONDS = 15;</span>
<span style="background-color:#fff0cf;"> private static final AtomicBoolean isShuttingDown = </span>
<span style="background-color:#fff0cf;"> new AtomicBoolean(false);</span>
<span style="background-color:#fff0cf;"> private static final int DEFAULT_RUNTIME_SECONDS = 20;</span>
<span style="background-color:#fff0cf;">// OTEL COMPONENTS</span>
<span style="background-color:#fff0cf;"> private static OpenTelemetry openTelemetry;</span>
<span style="background-color:#fff0cf;"> private static Meter meter;</span>
<span style="background-color:#fff0cf;"> private static LongCounter tasksProcessedCounter;</span>
<span style="background-color:#fff0cf;"> private static LongCounter taskProcessingTimeCounter;</span>
<span style="background-color:#fff0cf;">public static void main(String[] args) {</span>
<span style="background-color:#fff0cf;"> // INITIALIZE OTEL</span>
<span style="background-color:#fff0cf;"> openTelemetry = OpenTelemetryConfig.initialize();</span>
<span style="background-color:#fff0cf;"> meter = openTelemetry.getMeter("com.solarwinds.jvmmonitoring");</span>
<span style="background-color:#fff0cf;"> // CREATE METRICS</span>
<span style="background-color:#fff0cf;"> tasksProcessedCounter = meter.counterBuilder("tasks.processed")</span>
<span style="background-color:#fff0cf;"> .setDescription("Number of tasks processed")</span>
<span style="background-color:#fff0cf;"> .setUnit("1")</span>
<span style="background-color:#fff0cf;"> .build();</span>
<span style="background-color:#fff0cf;"> taskProcessingTimeCounter =</span>
<span style="background-color:#fff0cf;"> meter.counterBuilder("tasks.processing.time")</span>
<span style="background-color:#fff0cf;"> .setDescription("Total time spent processing tasks")</span>
<span style="background-color:#fff0cf;"> .setUnit("ms")</span>
<span style="background-color:#fff0cf;"> .build();</span>
<span style="background-color:#fff0cf;">// Parse runtime duration from command line args</span>
<span style="background-color:#fff0cf;"> final int runtimeSeconds = parseRuntimeDuration(args);</span>
<span style="background-color:#fff0cf;"> logger.info("Starting Task Processing System with {} threads, runtime: {} seconds", NUM_THREADS, runtimeSeconds);</span>
<span style="background-color:#fff0cf;"> // Create a thread pool with a bounded queue</span>
<span style="background-color:#fff0cf;"> ThreadPoolExecutor executor = new ThreadPoolExecutor(</span>
<span style="background-color:#fff0cf;"> NUM_THREADS, NUM_THREADS,</span>
<span style="background-color:#fff0cf;"> 0L, TimeUnit.MILLISECONDS,</span>
<span style="background-color:#fff0cf;"> new LinkedBlockingQueue<>(1000),</span>
<span style="background-color:#fff0cf;"> new ThreadPoolExecutor.CallerRunsPolicy()</span>
<span style="background-color:#fff0cf;"> );</span>
<span style="background-color:#fff0cf;">// Add shutdown hook for graceful termination</span>
<span style="background-color:#fff0cf;"> Runtime.getRuntime().addShutdownHook(new Thread(() -> {</span>
<span style="background-color:#fff0cf;"> logger.info("Shutdown signal received, initiating graceful shutdown...");</span>
<span style="background-color:#fff0cf;"> shutdownGracefully(executor);</span>
<span style="background-color:#fff0cf;"> }));</span>
<span style="background-color:#fff0cf;">// Add timer for automatic shutdown after specified runtime</span>
<span style="background-color:#fff0cf;"> new Thread(() -> {</span>
<span style="background-color:#fff0cf;"> try {</span>
<span style="background-color:#fff0cf;"> Thread.sleep(runtimeSeconds * 1000);</span>
<span style="background-color:#fff0cf;"> logger.info("Runtime duration of {} seconds reached, initiating shutdown...", runtimeSeconds);</span>
<span style="background-color:#fff0cf;"> System.exit(0);</span>
<span style="background-color:#fff0cf;"> } catch (InterruptedException e) {</span>
<span style="background-color:#fff0cf;"> Thread.currentThread().interrupt();</span>
<span style="background-color:#fff0cf;"> }</span>
<span style="background-color:#fff0cf;"> }, "shutdown-timer").start();</span>
<span style="background-color:#fff0cf;">// Create task processor</span>
<span style="background-color:#fff0cf;"> TaskProcessor processor = new TaskProcessor();</span>
<span style="background-color:#fff0cf;">try {</span>
<span style="background-color:#fff0cf;"> // Submit tasks to the executor</span>
<span style="background-color:#fff0cf;"> while (!isShuttingDown.get()) {</span>
<span style="background-color:#fff0cf;"> executor.submit(() -> {</span>
<span style="background-color:#fff0cf;"> try {</span>
<span style="background-color:#fff0cf;"> long startTime = System.currentTimeMillis();</span>
<span style="background-color:#fff0cf;"> processor.processNextTask();</span>
<span style="background-color:#fff0cf;"> long processingTime = System.currentTimeMillis() - startTime;</span>
<span style="background-color:#fff0cf;"> // RECORD METRICS</span>
<span style="background-color:#fff0cf;"> tasksProcessedCounter.add(1);</span>
<span style="background-color:#fff0cf;"> taskProcessingTimeCounter.add(processingTime);</span>
<span style="background-color:#fff0cf;"> } catch (InterruptedException e) {</span>
<span style="background-color:#fff0cf;"> Thread.currentThread().interrupt();</span>
<span style="background-color:#fff0cf;"> logger.debug("Task processing interrupted");</span>
<span style="background-color:#fff0cf;"> } catch (Exception e) {</span>
<span style="background-color:#fff0cf;"> logger.error("Failed to process task: {}", e.getMessage());</span>
<span style="background-color:#fff0cf;"> }</span>
<span style="background-color:#fff0cf;"> });</span>
<span style="background-color:#fff0cf;"> // Small delay to prevent overwhelming the system</span>
<span style="background-color:#fff0cf;"> Thread.sleep(10);</span>
<span style="background-color:#fff0cf;"> }</span>
<span style="background-color:#fff0cf;"> } catch (InterruptedException e) {</span>
<span style="background-color:#fff0cf;"> logger.info("Main thread interrupted, initiating shutdown...");</span>
<span style="background-color:#fff0cf;"> Thread.currentThread().interrupt();</span>
<span style="background-color:#fff0cf;"> } finally {</span>
<span style="background-color:#fff0cf;"> shutdownGracefully(executor);</span>
<span style="background-color:#fff0cf;"> }</span>
<span style="background-color:#fff0cf;"> }</span>
<span style="background-color:#fff0cf;">…</span>
<span style="background-color:#fff0cf;">}</span>
Now, you can run the application for 60 seconds and then see the telemetry metric data sent to SolarWinds Observability SaaS. Run the following commands in a terminal:
<span style="background-color:#fff0cf;">$ mvn clean package</span>
<span style="background-color:#fff0cf;">$ export \</span>
<span style="background-color:#fff0cf;"> OTLP_ENDPOINT=https://otel.collector.xx-yy.cloud.solarwinds.com:443</span>
<span style="background-color:#fff0cf;">$ export \</span>
<span style="background-color:#fff0cf;"> OTLP_INGESTION_TOKEN=replace-with-your-token</span>
<span style="background-color:#fff0cf;">$ java -jar target/jvm-monitoring-demo-1.0-SNAPSHOT.jar 60</span><span style="background-color:#fff0cf;font-family:inherit;">Confirm Data Ingestion With SolarWinds Observability SaaS</span>
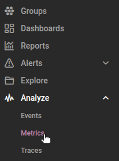
After running your application several times, it's time to confirm that the application is sending telemetry data to SolarWinds Observability SaaS. To do this, log in to your account and navigate to Analyze > Metrics.
On the Metrics page, search for metrics related to JVM. This returns a substantial list of metrics captured by your application.
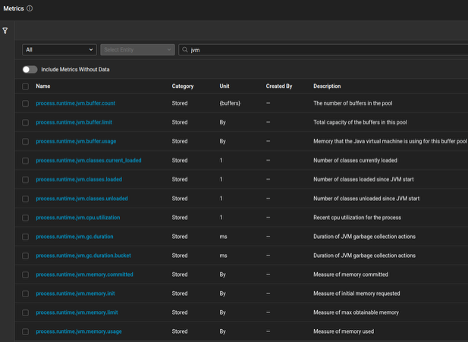
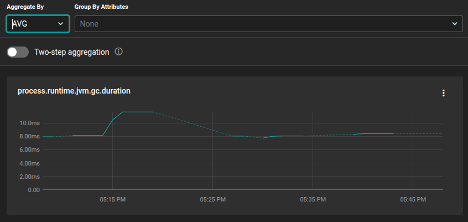
You can click on any individual metric to see a visualization. For example, <a style="background-color:#fff0cf;" href="https://opentelemetry.io/docs/specs/semconv/runtime/jvm-metrics/#metric-jvmgcduration">jvm.gc.duration</a> shows the duration of JVM garbage collection actions.
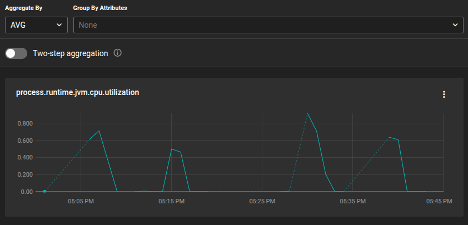
Or, you can look at <a style="background-color:#fff0cf;" href="https://opentelemetry.io/docs/specs/semconv/runtime/jvm-metrics/#metric-jvmsystemcpuutilization">jvm.cpu.utilization</a> , which shows the CPU utilization for the system as reported by the JVM.
With data now flowing into SolarWinds Observability SaaS, you can view, graph, and alert on key JVM signals.
Create Custom Dashboards
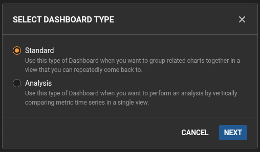
You can create custom dashboards to visualize multiple metrics side by side or overlaid on top of one another to get more value for your telemetry data. On the Dashboards page, click Create Dashboard. Select the Standard dashboard type and click Next.
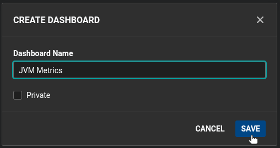
An empty dashboard will be created. Click Save. Specify a dashboard name, and then click Save again.
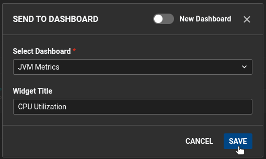
Navigate back to the Metrics Explorer. Find metrics that are directly related to your tuning and performance goals. Click on the three-dots menu for the metric. Then, click Send to Dashboard.
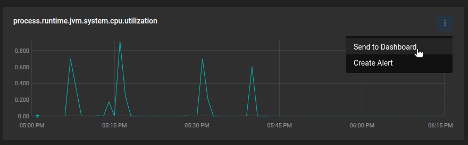
Choose your recently created dashboard from the dropdown list. Specify a name for the widget with your metric. Then, click Save.
Add more metrics to your dashboard, creating an all-in-one visualization to help you understand your JVM performance.
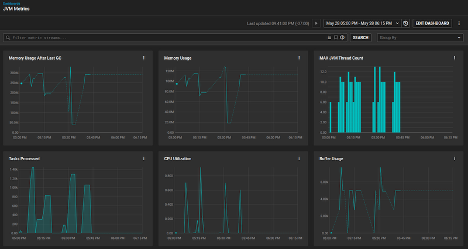
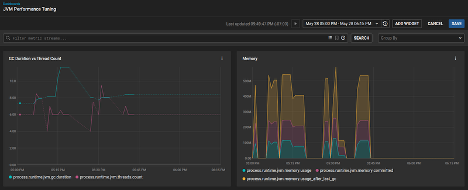
For metrics directly related to GC performance, compare GC action duration with thread counts and look at memory usage.
Analyzing and Tuning Your JVM
With metrics in hand, you can begin making targeted improvements. Here's how to diagnose issues and apply effective JVM tuning strategies.
Diagnose Performance Issues and Apply Targeted JVM Settings
Start by identifying common problem areas:
- GC issues: Frequent or long GC pauses may indicate poor garbage collector choice or memory pressure.
- Memory usage: Consistently high heap usage might indicate a memory leak or an undersized heap.
- Thread behavior: High or growing thread counts could signal contention or thread pool misconfiguration.
Once you've identified a potential issue, you can apply targeted changes to JVM configuration. For example:
- Adjust heap size.
- Choose a better GC algorithm. Depending on your pause time and throughput needs, try alternatives like G1, ZGC, or Shenandoah.
- Reconfigure thread pools, ensuring they aren’t oversized or leaking threads.
After applying changes, compare metrics before and after to validate improvements.
Put Your Telemetry to Work
With just a few configuration steps, you can capture rich JVM internals using OpenTelemetry and view them in SolarWinds Observability SaaS. This visibility helps you troubleshoot, tune, and optimize with confidence.
If you haven’t already, start by instrumenting a test Java app and explore the metrics in your SolarWinds Observability SaaS account. Check out the SolarWinds OTel integration guide for more details and options.