Today's applications are complex, distributed systems designed to deliver seamless user experiences. But when performance issues strike—like slow page loads, mysterious errors, or unexpected downtime—teams need visibility to pinpoint and fix these urgent problems.
Two essential tools help IT teams gain that visibility: transaction monitoring and transaction tracing. At first glance, their purposes appear distinct, yet together, they are complementary avenues to pinpoint performance issues. Transaction tracing explores the pathways of transactions by looking into internal systems and highlighting bottlenecks. From an external perspective, transaction monitoring simulates user action to assess application health. Combined, these two approaches provide a more complete picture of how to resolve performance issues efficiently.
Understanding when and how to use each tool can make all the difference in quickly resolving performance bottlenecks. In this post, we’ll explore how transaction monitoring and tracing complement each other, looking at real-world scenarios where combining them can significantly enhance your troubleshooting workflow. Along the way, we’ll also consider how SolarWinds Observability SaaS supports IT teams by providing transaction monitoring and transaction tracing capabilities.
Transaction monitoring vs. transaction tracing: what's the difference?
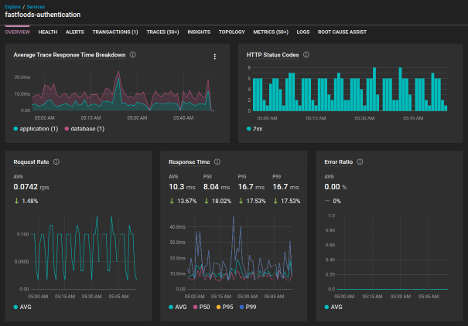
Transaction monitoring is like your application's health check dashboard. It tracks overall metrics—such as response times, request volumes, and error rates—to give your team a quick snapshot of application health. For a proactive way to monitor transactions, synthetic transactions can be used to simulate user flows that span multiple web interactions, mirroring a real-world user journey. This can provide a helpful look into user transaction health and performance. With transaction monitoring, you can:
- Quickly spot when performance begins to dip.
- Set alerts to notify your team of anomalies to proactively explore potential issues before they impact users.
- Identify broader trends or recurring issues affecting user experience.
Monitoring tells you what is happening, but not necessarily why. And that’s where tracing comes in.
Transaction tracing is your magnifying glass, providing detailed visibility into a single request as it flows through your application. It reveals specifics like API calls, database interactions, and dependencies between services. Tracing allows your team to:
- Track precisely how a single request navigates through your system.
- Identify bottlenecks—such as slow database queries or problematic integrations.
- Quickly isolate the root cause of issues that monitoring alone might highlight but not fully explain.
Scenario #1: Resolving slow API responses
When users report sluggish page loads or delayed interactions, your team faces the challenge of pinpointing the underlying issue. Is it within the application itself, or in a third-party integration, or is there a bottleneck in the infrastructure?
In this scenario, transaction monitoring provides a broad view of system performance, highlighting key issues such as:
- Latency spikes
- Increased response times
- Endpoint slowdowns
By reviewing these high-level metrics, teams can detect when and where performance degradation occurs. However, while monitoring identifies the symptoms, it doesn’t always reveal the underlying cause. That’s where transaction tracing becomes a helpful tool to zoom in and diagnose the issue by analyzing the execution of a request from start to finish. For example, tracing a slow API request may reveal that a specific database query is taking too long to return results, or that an external API dependency is introducing delays. With such a granular level of visibility, teams can zero in on the problem. From there, a solution may become clearer. Teams can determine if they need to optimize queries, introduce caching mechanisms, or adjust infrastructure capacity.
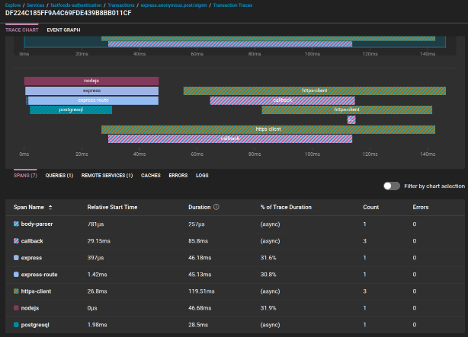
A robust observability solution streamlines this process by offering dashboards and alerts that notify teams of performance degradation. With SolarWinds Observability SaaS, for example, teams can visualize transaction heatmaps and set alerting thresholds for response times. Then, they can drill into individual traces to determine the root cause of slowdowns.
By leveraging monitoring and tracing, IT teams can proactively manage API performance and ensure a smoother user experience.
Scenario #2: Debugging intermittent errors
Intermittent errors present a unique challenge because they are difficult to reproduce and diagnose. One moment, an application functions perfectly; the next, certain users report failures with no clear pattern. Teams are left searching for anomalies across logs, infrastructure, and dependencies without a consistent trigger.
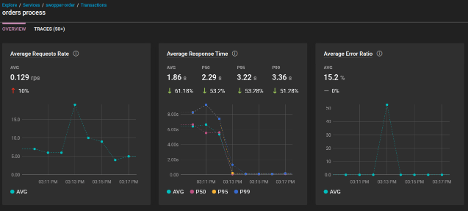
Transaction monitoring provides a starting point by surfacing spikes in failed transactions and identifying which services or endpoints are affected. For example, if an API endpoint shows an increased failure rate, it suggests that the issue is not random but tied to specific conditions.
Try tracing individual failed requests to truly uncover what’s causing the errors. By examining individual traces, teams can determine whether failures are tied to a database timeout, an unhandled exception in the code, or a misconfigured dependency. Tracing also helps correlate failures with external factors, such as recent deployments or infrastructure changes, making it easier to isolate the source of the issue.