Kubernetes is powerful, but it can also be dizzyingly complex. It creates a complex abstraction layer between the application and the infrastructure that supports it, which can complicate operations monitoring. That makes observability a must-have. Without clear visibility into cluster performance, resource allocation, and workload health, your IT team risks performance bottlenecks and potential outages.
SolarWinds® Observability SaaS simplifies Kubernetes monitoring by providing real-time insights into your environment. With its unified dashboards, automated alerts, and deep performance metrics, SolarWinds Observability SaaS can help your team detect and resolve issues swiftly before they impact your application or user experience.
In this post, we’ll examine eight common Kubernetes performance problems and how you can use SolarWinds Observability SaaS to detect and resolve issues.
Issue #1: Under-provisioned resources
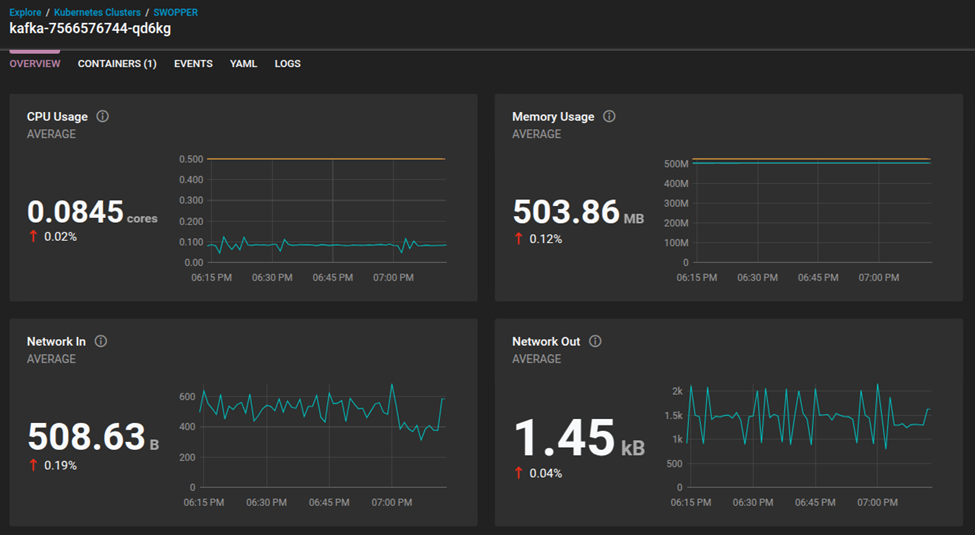
When Kubernetes workloads don’t have sufficient CPU/memory resources allocated, they can experience performance degradation. What might this look like? You’ll potentially see CPU throttling, excessive garbage collection, or pods getting killed due to out-of-memory conditions. As a result, applications become sluggish, unresponsive, or crash under load.
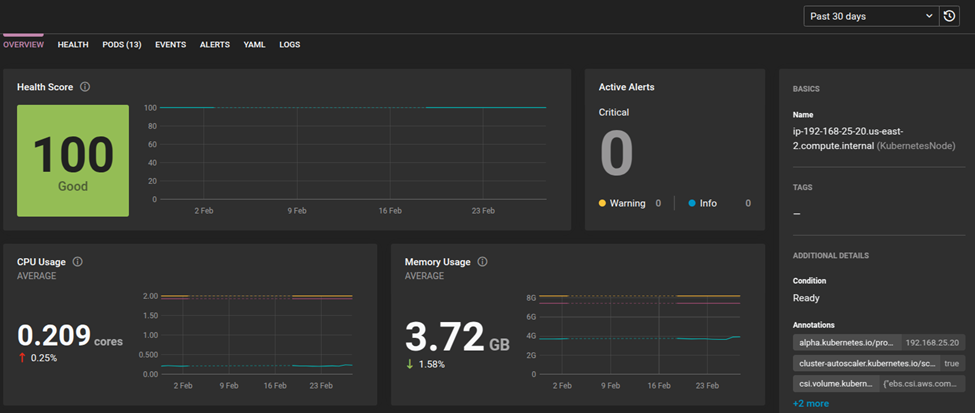
SolarWinds Observability SaaS helps identify this issue by monitoring CPU throttling, memory exhaustion, and pod eviction events. The dashboard views display historical trends and highlight when resource consumption exceeds allocated requests.
After applying the changes, return to SolarWinds Observability SaaS dashboards for Kubernetes to confirm that CPU throttling and memory exhaustion metrics have stabilized, ensuring workloads run smoothly.
Issue #2: Over-provisioned resources
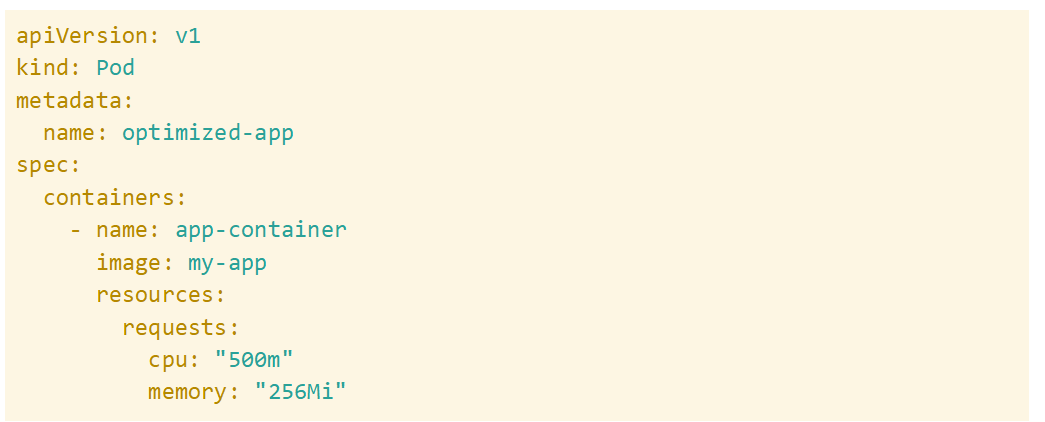
Over-provisioning occurs when workloads request significantly more CPU and memory than they need. This leads to inefficient resource allocation, where some workloads may struggle to secure the necessary resources while other pods remain underutilized.
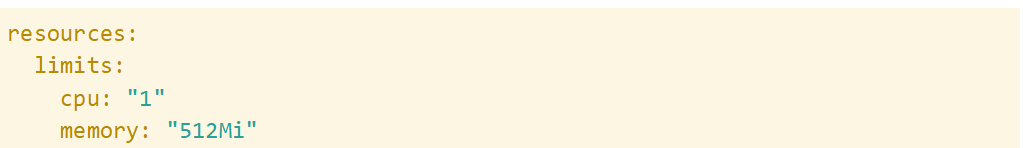
SolarWinds Observability SaaS highlights nodes with low utilization but high CPU/memory reservations, allowing teams to identify inefficiencies and reclaim wasted capacity. You can set resource limits to prevent workloads from claiming excessive CPU and memory; this practice leads to better utilization of cluster resources and helps reduce costs.
After adjusting limits, use SolarWinds Observability SaaS Kubernetes views to verify that the overall resource allocation is more balanced across the cluster, leading to higher efficiency.
Issue #3: Traffic spikes
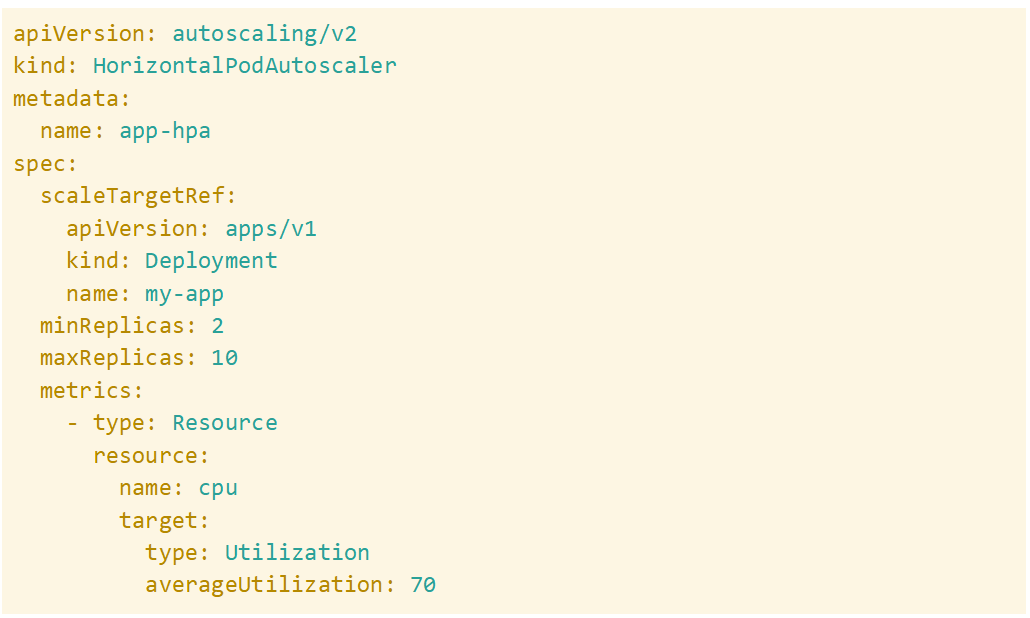
If Kubernetes workloads lack the ability to dynamically scale, they may struggle with sudden traffic increases. Spikes in user requests can overwhelm existing pods, causing increased response times, timeouts, or application crashes.
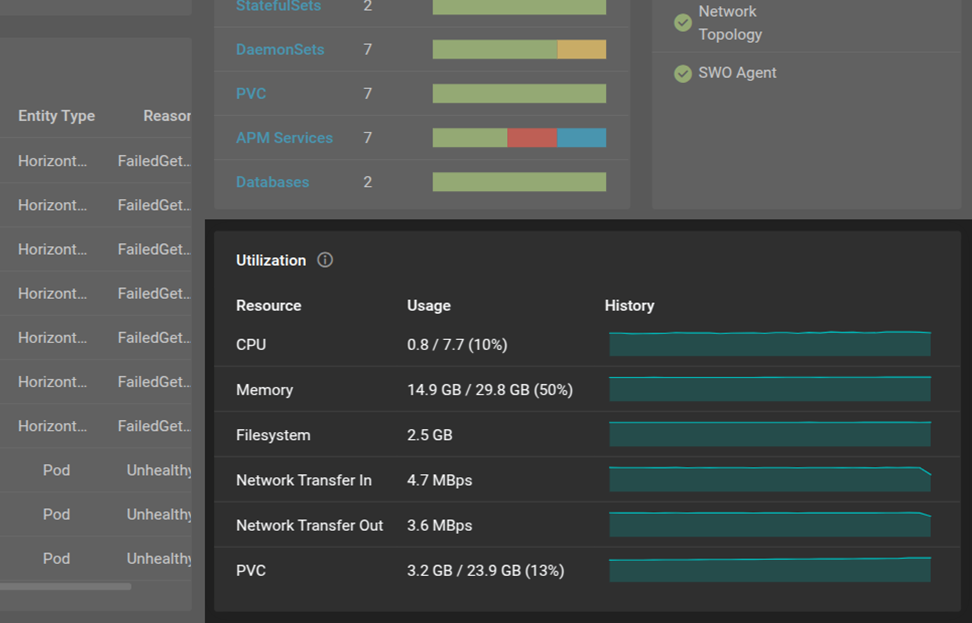
SolarWinds Observability SaaS tracks request latency, pod failure rates, and CPU/memory utilization surges during high-traffic periods to help you detect issues. Implementing the Horizontal Pod Autoscaler or Vertical Pod Autoscaler helps ensure workloads scale dynamically, keeping applications responsive under fluctuating loads. For example:
Issue #4: Unbalanced load distribution
Traffic distribution problems arise when some pods receive significantly more requests than others. This can lead to performance degradation in overloaded pods, while underutilized ones remain idle.
SolarWinds Observability SaaS provides insights into CPU/memory usage across pods, helping teams identify uneven load distribution.
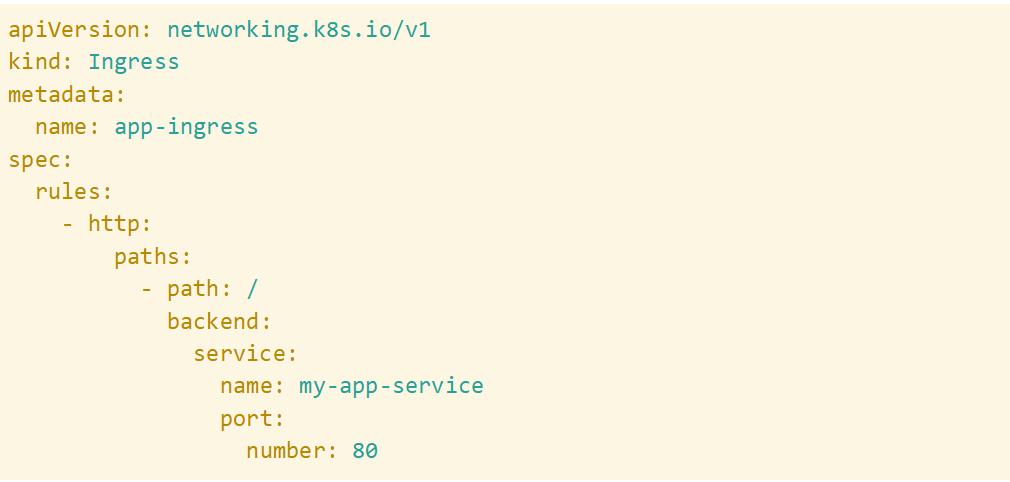
Tuning Ingress rules and Service load balancing distributes requests more evenly across all replicas, improving application performance and reliability.
After making changes, you can verify that traffic is more evenly distributed across replicas by consulting the Kubernetes view in SolarWinds Observability SaaS. Actively managing traffic distribution can help you prevent bottlenecks and improve response times.
Issue #5: Excessive container restarts
Frequent container restarts indicate underlying issues, such as application crashes, misconfigured probes, or failed dependencies. These restarts can cause disruptions, slow recovery times, and inconsistent service availability.
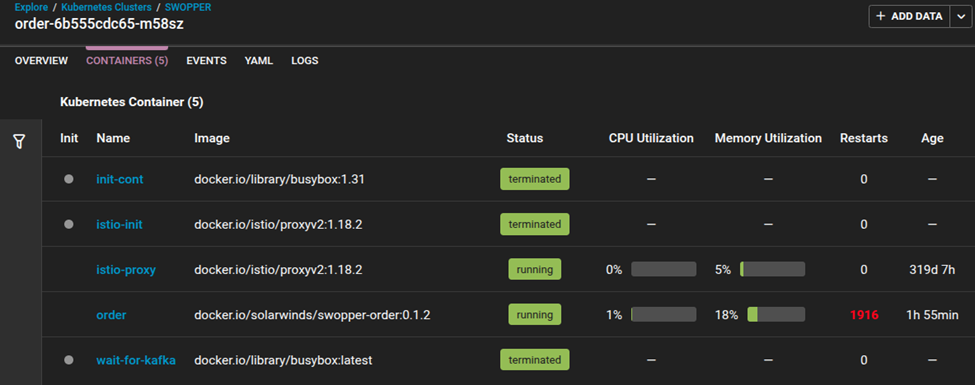
The container view in SolarWinds Observability SaaS helps identify restart issues by tracking container restart counts, failed health checks, and error logs.
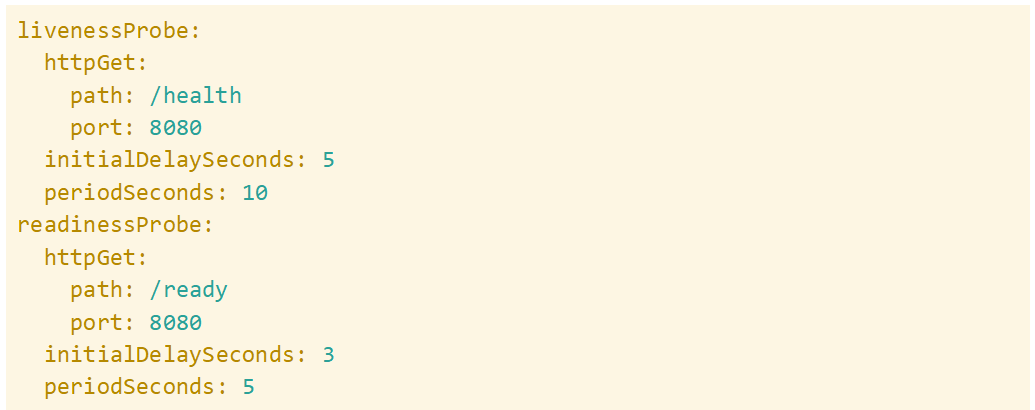
Fixing readiness and liveness probes helps ensure Kubernetes properly determines when a pod is healthy and ready to serve traffic.
After applying the fix, check the container view in SolarWinds Observability SaaS to confirm that pod restarts have decreased and service availability has stabilized.
Issue #6: Poor resource utilization
When workloads are not scheduled efficiently, some nodes remain underutilized while others experience high loads. This can impact overall cluster performance and lead to wasted computing power.
SolarWinds Observability SaaS provides insights into node utilization trends, helping teams balance workloads more effectively.
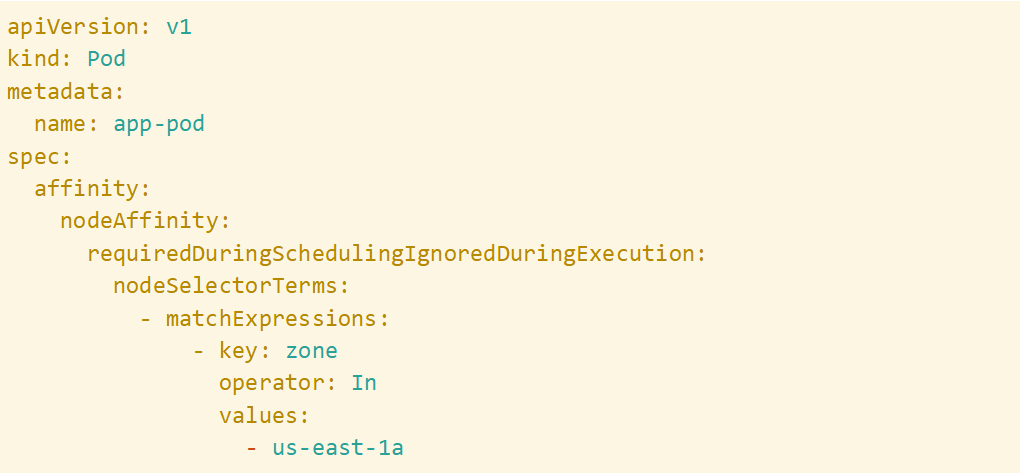
Using node affinity and pod affinity/anti-affinity helps distribute workloads optimally, which can support better resource utilization.
To reduce resource imbalances, you can monitor cluster utilization in SolarWinds Observability SaaS dashboards and verify workloads are well distributed.
Issue #7: Pending pods due to scheduling constraints
Pods may remain in a Pending state if there are insufficient resources in the cluster or if node affinity and tolerations restrict where they can be scheduled. This can delay application availability and cause service disruptions.
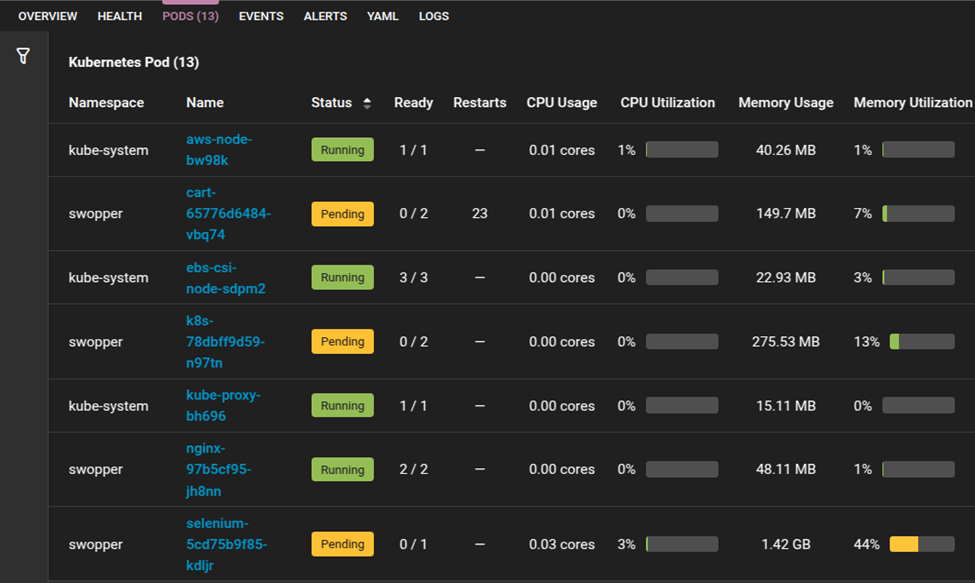
You can use the views in SolarWinds Observability SaaS to identify pods stuck in pending status and surface scheduling constraints and provide insights into available node resources.
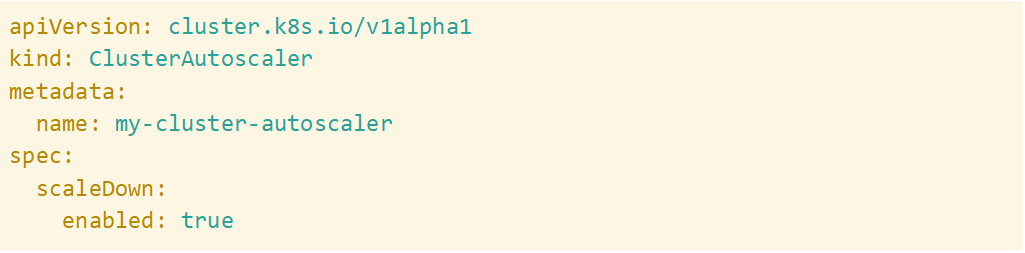
To resolve this, consider using Cluster Autoscaler to dynamically provision additional nodes when required or adjust scheduling constraints, such as node affinity and tolerations.
After applying these changes, return to SolarWinds Observability SaaS to confirm the previously pending pods are successfully scheduled and running.
Issue #8: High network latency
Slow service-to-service communication can degrade application performance, leading to delayed API responses and timeouts. This can be caused by inefficient routing, overloaded network interfaces, or misconfigured service discovery.
You can track response times, packet loss, and connectivity issues using views in SolarWinds Observability SaaS and pinpoint latency sources. Optimizing ClusterIP routing and service mesh settings can improve network efficiency by ensuring faster internal traffic resolution and reducing unnecessary hops.

Monitor the performance views in SolarWinds Observability SaaS to confirm that network response times have improved, and latency has been reduced.
Conclusion
Maintaining peak Kubernetes performance requires proactive monitoring and optimization. The holistic performance view provided by an observability solution, such as SolarWinds Observability SaaS, is an effective way to gain the necessary visibility to help prevent bottlenecks and mitigate system outages. With SolarWinds Observability SaaS, teams can detect, diagnose, and resolve performance issues efficiently. To get started with SolarWinds Observability SaaS, sign up for a fully functional 30-day trial or test drive an interactive demo.