We’re excited to announce version 2025.1 of the SolarWinds® Platform, SolarWinds® Observability Self-Hosted, and the Network and Systems modules is now generally available. Version 2025.1 is now available for all customers under maintenance, so log in to your customer portal to download it. Want to see everything new? Check out the Release Notes.
You can see some of the new features in this video:
Here is a quick list of all the major features with links to a post with more detailed information:
Observability Self-Hosted exclusives:
- Expanded Cloud Monitoring:
- Support for Google Cloud Platform
- Azure: App Services and Blob Storage
- AWS: Elastic Load Balancing and Databases (MySQL, Aurora MySQL, PostgreSQL and Aurora-PostgreSQL, and Oracle)
- Improved Polling Scalability
Observability Self-Hosted, Network, and Infrastructure Modules
- Expanded Network Support
- Enhanced support for Aruba and Fortinet Switch
- API Only polling for Velocloud and Prisma SD-WAN
- Support for Ruckus SmartZone Wireless Network Controller
- Storage:
- HPE Alletra 5k, 6k, 9k and GreenLake for Block
- Dell PowerStore “Q” models
SolarWinds Platform (available to all products)
- Modern Dashboards: Action Menu and NOC Mode with Dark Theme
- Intelligent Maps: Set link destination for entities on widgets and define global default settings.
- Windows Polling: WinRM is now the default
- Bug and security fixes
Observability Self-Hosted Exclusives
Expanding Our Multi-Cloud Coverage with GCP support
We're excited to announce the first phase of our Google Cloud Platform (GCP) integration with Observability Self-Hosted, marking an expansion of our multi-cloud observability capabilities.
In this initial release, we're focusing on Google Compute Engine (GCE) monitoring, providing our users with comprehensive visibility into their Google Compute Engine environments. Our integration delivers:
- Overview of the GCE compute instances
- Real-time monitoring of compute instances
- Resource utilization widgets
- Basic network performance metrics
- Additional metrics related to GCE instances
Just as we've done with AWS and Azure, our GCP support will evolve and expand with each release. See it in the demo site!

Support for Azure App Services
We are introducing monitoring capabilities for Azure App Services, a managed platform for building, deploying, and scaling applications. These enhancements allow users to gain deep and actionable visibility into their application environments to ensure reliable performance and a consistently high-quality user experience. Integrating Azure App Services monitoring directly into your existing observation workflow lets you see how your applications run, scale, and respond under different conditions.
This expanded coverage offers a significant advantage: you can now closely monitor resource allocation, performance efficiency, and system behavior without juggling multiple tools. Important aspects of resource usage and workload characteristics are captured. These insights help identify performance bottlenecks, fine-tune application parameters, and anticipate future capacity needs.
What really makes this feature useful is the ability to accurately identify slowdowns, latency issues, and unexpected drops in throughput. This allows you to respond quickly before application users are impacted. These details will enable you to optimize code confidently, adjust infrastructure provisioning, and refine operational strategies.


Support for Azure Blob Storage
Building on the momentum of our expanded Azure Cloud Services coverage, we’re also rolling out advanced visibility into Azure Blob Storage as a scalable object storage service. By integrating this enhanced observability, you can better understand how your cloud storages align with performance objectives, how replication strategies safeguard critical data, and how usage patterns evolve under changing workloads. With this new capability, you’ll gain insights into current configurations, enabling proactive decision-making. Identify performance bottlenecks, ensure resources are allocated efficiently, and validate that your data placement aligns with requirements. These insights directly translate into improved predictability and more informed scaling and cost-control measures.
As data operations become increasingly complex, our new Azure monitoring capabilities help you maintain high availability, manage transactions smoothly, and reduce latency, all from within a single, unified platform.


Expanded support for AWS RDS
Amazon Relational Database Service (Amazon RDS) is a managed service designed to simplify the setup, operation, and scaling of relational databases in the cloud. We have expanded monitoring support for Amazon RDS environments, including MySQL, Aurora MySQL, PostgreSQL and Aurora-PostgreSQL, and Oracle databases. See them in the demo site!
By integrating these crucial engines into our unified observability solution, you gain a single pane of glass for tracking performance, resource utilization, and operational health across your entire database landscape. With this new addition, you can drill down into real-time metrics and historical trends to identify inefficient queries, preemptively adjust resource allocations, and ensure continuous availability. Comprehensive insights from Observability Self-Hosted cloud database monitoring help your team stay proactive and agile.

Support for AWS Elastic Load Balancing
We are pleased to introduce the addition of AWS Elastic Load Balancing (ELB) monitoring, offering more profound insight into how traffic is distributed and managed across your AWS cloud infrastructure. With this new capability, you can better understand how ELB impacts application availability, identify usage patterns, and fine-tune your load-balancing strategies.
This feature empowers you to monitor traffic utilization, detect potential performance issues, and ensure efficient handling of incoming requests under varying conditions. Instead of relying on fragmented data, you’ll have a centralized view of ELB performance metrics, enabling precise adjustments that improve reliability and responsiveness.
Whether scaling to meet sudden demand spikes or ensuring high availability for critical services, ELB monitoring provides the clarity needed to optimize configurations and maintain consistent performance.

Increased Scalability for Additional Performance Engines
For Observability Self-Hosted products, the maximum scale supported by an Additional Polling Engine has increased from 72,000 elements to 100,000 elements (SNMPv2) on the same hardware, a 38% increase (and >100% increase since 2024.2). For SNMPv3, the maximum increases from 60,000 to 72,000 elements. This improved scalability allows you to deploy fewer APEs in your environment, reducing the total cost of ownership. Note that tests are being run to measure the improvements in WMI and WinRM polling; those results will be added as they are available.
Customers who own modules or Network Automation Manager will see improved resource utilization and better stability when near the maximum number of supported elements.
Create High Availability Pools greater than two members in the UI
In 2024.2, we introduced the ability to have HA pools larger than two members, but the configuration was limited to the API only. In this release, we added the ability to configure HA Pools via the web console. You’ll see this extra ability when you create or edit an HA Pool. This allows you to have a many-to-many ratio of active and stand servers in an HA Pool—for example, Pool: 4 Active engines and 1 Standby engine.
Observability Self-Hosted, Network, and Infrastructure Modules
Enhanced SNMP Monitoring for Aruba and Fortinet Switches
These feature expansions continue to position SolarWinds focus on multi-vendor network monitoring, meeting the needs of today’s dynamic, security-focused network landscapes
Improved SNMP Monitoring for Aruba Switches, adding vital Layer 2 and Layer 3 metrics that enhance fault isolation, network health assessment, and troubleshooting capabilities. Key metrics now included are:
- Layer 2: MAC Address Table Utilization, Spanning Tree Protocol (STP) Status, VLAN configuration and usage, CDP/LLDP topology.
- Layer 3: IP address monitoring, routing table utilization, ARP features, and advanced hardware health metrics.
Improved SNMP Monitoring for Fortinet Switches, providing expanded visibility into Layer 2 and Layer 3 metrics. Notably, Fortinet’s limited SNMP exposure has been optimized to support:
- Layer 2: MAC Address Table Utilization, VLAN configuration and usage, CDP/LLDP topology.
- Layer 3: ARP Table Utilization.
Note: Metrics such as STP Status and Routing Table Utilization are currently unavailable due to Fortinet’s SNMP limitations but will be covered in a future release through API polling.
See the improvements for Aruba in the demo site!
API Only Polling for VeloCloud and PA Prisma SD-WAN
For VeloCloud and PA Prisma SD-WAN edge devices, we now support API-only polling, removing SNMP-based dependency in monitoring. This change aligns with modern security requirements, as SNMP is disabled for SD-WAN edge nodes by default. API-only polling continues to capture essential SD-WAN metrics.
See an example in the demo site!
Support for Ruckus SmartZone Wireless Network Controller
Wireless Access Point Monitoring for Ruckus SmartZone Network Controller includes detailed API-based monitoring for Ruckus SmartZone controllers, adding visibility to wireless network health and utilization metrics. The new metrics include:
- Network strength and utilization
- Total access points and user counts
- Rogue access point signal strength
- CPU and memory utilization
- Wireless traffic statistics (total bytes sent/received by APs and clients)
These enhancements give you visibility into Ruckus wireless environments, both Ruckus One (cloud) and Ruckus SmartZone (on-premises) solutions.
See it in the demo site!
Support for HPE Alletra and Dell PowerStore “Q” Devices
Get capacity, performance, and hardware health data to monitor and visualize the storage that underpins your business-critical applications.
- HPE Alletra: Models 5k, 6k, 9k as well as GreenLake for Block
- Dell: PowerStore “Q”
See the Alletra in the demo site!
SolarWinds Platform (available to all products)
Improvements to Modern Dashboards
NOC Mode
You’ve loved it in classic dashboards and now you can enjoy it in Modern Dashboards. Since we introduced tabs to Modern Dashboards in 2024.4, it seemed like the next logical step was NOC mode!
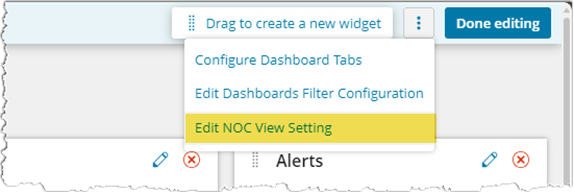
When you edit a Modern Dashboard, you’ll see a new sitting to Edit NOC View Settings.
You’ll be able to enable NOC Mode and define how much time before rotation to the next tab.
Dark Theme for NOC Mode
Dark Theme…need I say more? We are getting our feet wet in this release by bringing in Dark Theme to Modern Dashboards. However, there is a catch, this version only allows Dark Theme when viewing a Modern Dashboard in NOC Mode. This was a conscious decision for this specific release. We absolutely plan to bring Dark Theme to all Modern Dashboards without NOC Mode in a future release. This release allows us to test the waters and get it right. For our users that have Modern Dashboards up on a large TV screen, typically shown in NOC mode, it allows them to not have to wear sunscreen while viewing it.

Action Menu
What’s an Action Menu? Well, I guess it’s a place that you can perform actions! In Modern Dashboards, you’ll have a new Actions dropdown menu on the top right of the page. This will become more pertinent as we continue to expand out the Modern Dashboard framework, but for now, this is where you can manually refresh the page and enter NOC Mode. We didn’t want to have to top right corner too cluttered with different links to do different things, so we’ve tucked them into the Action Menu.

Improved Intelligent Maps
You can now edit the URL destination for objects in maps when they are displayed in widgets. The ability to define default settings for new maps globally has been added to the advanced settings. This will help you save time when creating maps. Your favorite custom settings will be applied to all newly created maps. We have also improved the import tool for Network Atlas maps. There is a new configuration available that allows you to control how nested maps are handled when importing from Network Atlas.
Everything Else
- Polling Windows servers remotely will now default to WinRM and fall back to WMI when needed.
- Added Peak memory usage (percent) for servers (Windows and Linux)
- Security and bug fixes
Security Always
We focus on securely coding, building, and delivering software to you. SolarWinds Aims to Set New Standard in Software Development with Next-Generation Build System. Our choices in forging the SolarWinds Platform align with our Secure by Design philosophy, enhancing our ability to execute this vision now and in the future.
How to Download
The 2025.1 release candidate is a fully tested and supported version and is ready to install on a new server or update your current one.
- For all current Observability Self-Hosted customers, the release is available now. You can log in to your customer portal and download it.
- For all current module and bundle customers, the release is available now. You can log in to your customer portal and download it.
- If you don’t own Observability Self-Hosted but would like to try it or one of its new features, there are a couple of options for you:
- Download a 30-day free trial and install it on a new server.
- If you’re a current module or bundle customer, upgrade to 2025.1 first and use the instant evaluation feature to try Observability Self-Hosted for 30 days with a click of a button. You can switch back to your modules anytime.
To see everything included in the release, check out the Release Notes.
What’s Next?
The 2025.1 release of the platform and products is another step forward, but there is always more to do. Check out our What We’re Working On post for what’s coming next for the SolarWinds Platform and products.
—The Observability Self-Hosted Team