Is your SQL Server estate virtualized on VMware? More than likely, the answer is yes, unless you have already moved on to the cloud. How often do DBAs get input into how SQL Server is virtualized? In my experience, I never had input into how SQL VMs were configured until after the fact. When looking at the SQL Server on VMware Best Practices Guide, I assume there are a lot of data points that VMware admins gloss over in relation to the virtualized SQL Server. One of the great things about virtualization is the ability to over-subscribe a host from a CPU perspective. Over-subscription saves energy and rack space in data centers. If you are unfamiliar with over-subscription, it is the allocating of more virtual CPUs to VMs than physical CPUs on an ESXi host.
You can easily check the over-subscription ratio using Powershell and PowerCli modules from VMware.
Get-Cluster | Sort name | Select Name, @{N="CpuOversubscriptionFactor";E={[math]::Round((($_|get-VM|measure numcpu -sum).Sum)/(($_|get-vmhost|measure numcpu -sum).sum)/2,2)}}
Over-subscription is great until it isn’t for SQL Server VMs. When the VM running SQL Server requests CPU from the host and does not have the required CPU resources due to over-subscription, you will run into CPU Ready and/or Co-Stop Waits. These are waits from the ESXi host, not from SQL Server. When dealing with this issue, all other performance counters for SQL Server look fine, but SQL Server is slow or even unresponsive. Here is a brief explanation of these two types of waits from VMware KBs.
CPU Ready
- This value represents the percentage of time that the virtual machine is ready to execute commands but has not yet been scheduled for CPU time due to contention with other virtual machines.
Co-Stop
- This value represents the percentage of time that the virtual machine is ready to execute commands but is waiting for the availability of multiple CPUs as the virtual machine is configured to use multiple virtual CPUs.
Here is the link to these definitions.
For more information, I recommend watching this video, Virtual SQL Server Performance Tuning, by David Klee:
https://youtu.be/jyuIvmLD0Vw?si=TNMQBy_Ph0P72WI4
How can we, as DBAs, help mitigate the issue of Co-Stop and CPU Ready waits? We aren’t VMware admins. Some folks in the SQL Server community, in general, have said that “most people don’t read manuals.”
The SQL Server on VMware Best Practices Guide section 3.5.2 states:
“When performance is the highest priority of the SQL Server design, VMware recommends that, for the initial sizing, the total number of vCPUs assigned to all the VMs be no more than the total number of physical, not logical, cores available on the ESXi host machine. By following this guideline, you can gauge performance and utilization within the environment until you can identify potential excess capacity that could be used for additional workloads. For example, if the physical server that the various SQL Server workloads currently run on equates to 16 physical CPU cores, avoid allocating more than 16 virtual vCPUs for the VMs on that vSphere host during the initial virtualization effort.
Taking a more conservative sizing approach helps rule out CPU resource contention as a possible contributing factor in the event of sub-optimal performance when virtualizing SQL Server implementations.”
https://docs.vmware.com/en/VMware-vSphere/8.0/vsphere-security/GUID-412EF981-D4F1-430B-9D09-A4679C2D04E7.html
Wow … that’s a 1:1 ratio. It makes you think a little bit differently about how many SQL VMs you can put on an ESXi host—at least, some more consideration and thought are required when we are virtualizing SQL Server.
What are some ways DBAs can monitor CPU contention in the virtualization layer?
If you can access vCenter, you can begin investigating these metrics. As mentioned in the previous David Klee video, this approach has specific challenges as vCenter will heavily aggregate the data, often flattening out the spikes in CPU Ready and Co-Stop metrics.
You can roll your own using Powershell and PowerCLi. It’s a daunting task and will detract from your regular day job as a DBA.
SolarWinds SQL Sentry can provide insight into your virtualized SQL Servers. Inside SQL Sentry, you can add your vCenter to a read-only account. This will allow SQL Sentry to capture vCenter metrics.
Once you have added your vCenter into SQL Sentry, you can view CPU Ready and Co-Stop metrics on your CPU dashboard.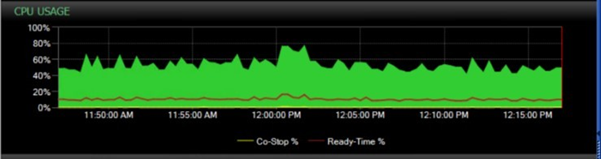
SQL Sentry will give you insights into “noisy neighbor” scenarios. SQL VMs consume many CPU resources in relation to the rest of the VM Guests on the ESXi host.
SQL Sentry captures more than just CPU-ready and Co-Stop metrics. The following link shows all the VMware metrics that were captured. https://docs.sentryone.com/help/VMware-performance-metrics
SQL Sentry allows you to create Alerting Conditions around these VMware metrics. Here are some that come out of the box:
- VMware High Ballooning
- VMware High Co-Stop%
- VMware High Ready Time % per vCPU
- VMware High Ready Time % per vCPU—Warning
- vCenter Offline
- VMware Host Offline
- Virtual Machine: VM Moved
Check out the following links for more specifics about monitoring your virtualized SQL Server:
https://documentation.solarwinds.com/en/success_center/sqlsentry/content/performance-analysis/VMware/overview.htm
https://orangematter.solarwinds.com/2019/10/31/strategies-best-practices-virtualizing-sql-server/
I hope you will find this quick read informative and helpful for a deeper dive into monitoring your virtualized environment.