When your sales rep pitches “observability” as something new and big in user experience monitoring, it can feel like a gimmick—another fancy word for uptime monitoring with a heftier price tag. But you might want to take a deeper look at the difference.
According to a recent GigaOm survey, observability transforms digital experience monitoring to deliver a comprehensive performance view of the entire web application. Observability enables you to evaluate the health and performance of your web applications by analyzing performance data from all the elements of the systems supporting and interacting with the application—users, application layers, instances, hosts, networks, and databases.
Before off-the-shelf observability solutions, DevOps and IT Ops teams jumped from one monitoring tool to another or cobbled together data from multiple monitoring tools with scripts to get a complete view of the web application. For example, a team receives an alert from SolarWinds® Pingdom indicating that application response times have crossed a performance threshold. They then open VMware Cloud to see if resource or CPU metrics have changed and then open MongoDB Atlas to look at error rates.
Of course, using an assortment of monitoring tools for the different elements supporting a web application means everyone on the team needs to know how to use multiple tools and can correlate cross-tool performance metrics. The need to connect and interlace performance data from different tools complicates troubleshooting end-to-end flows, slows issue identification and resolution, and results in performance blind spots. For web application owners, this translates into more downtime for your users and a significant revenue or reputation impact risk.
Grab the golden ring—spot issues before your customers do
A holistic observability solution, such as SolarWinds Observability SaaS, is designed to address these challenges. SolarWinds Observability SaaS enables you to collect and monitor performance data from the user experience, application, systems, network, and databases, all from a single solution. SolarWinds Observability SaaS interlaces and correlates the varied data points to provide a unified, comprehensive view of web application behavior. It can give you a 360° view of web application behavior you can use to identify bottlenecks, underutilized resources, and opportunities to tune performance.
Understanding the complex relationships between the different elements supporting a web application, SolarWinds Observability SaaS enables you to identify performance trends and potential issues before they impact users. The same understanding also simplifies and accelerates troubleshooting. You can quickly track cross-system flows, explore relationships, and understand interdependencies to eliminate blind spots.
Click to connect data points and transform troubleshooting
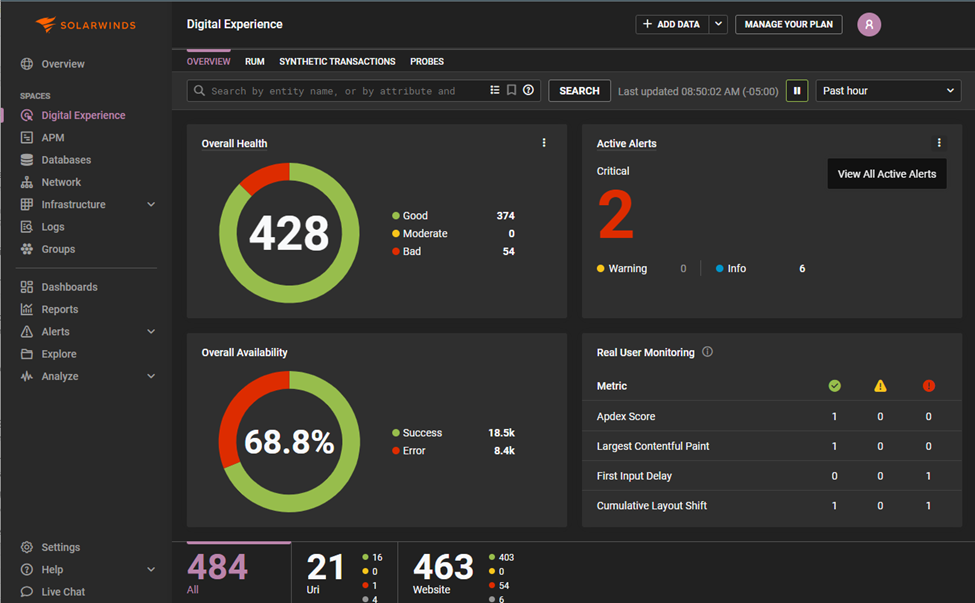
Like most monitoring tools, SolarWinds Observability SaaS generates alerts when performance metrics change unexpectedly, such as spikes in site traffic, access errors, and database latency. However, SolarWinds Observability SaaS takes it further and correlates real-time performance data to identify emerging trends. The trends and correlations are easily accessible in the interactive dashboard and drill-down views, allowing teams to identify changes quickly and under the cause.
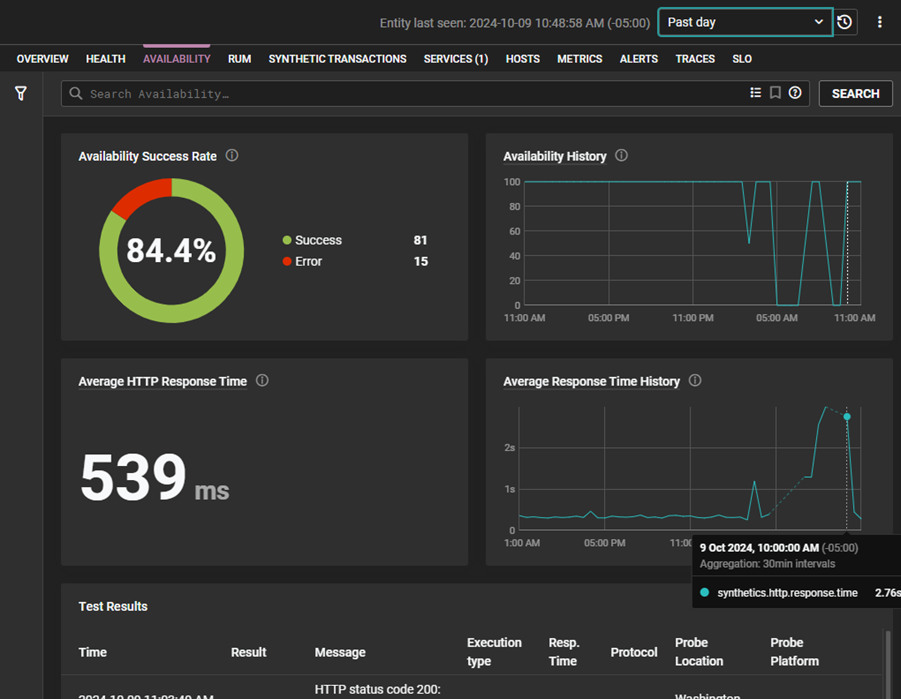
You can view the availability and response rate history with a single click when you receive an alert indicating that the response time has increased beyond a threshold. You can quickly determine if this is an anomaly or a typical pattern and visualize when the issues appeared for the first time.
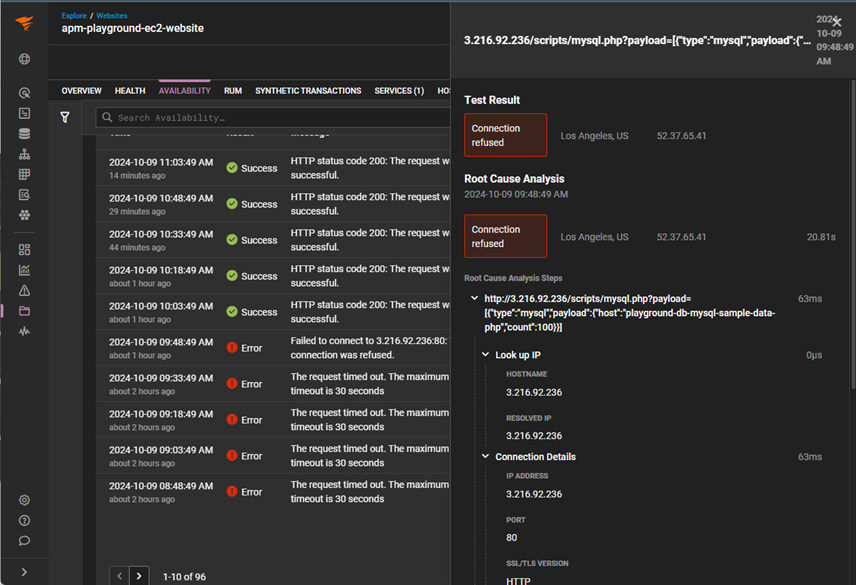
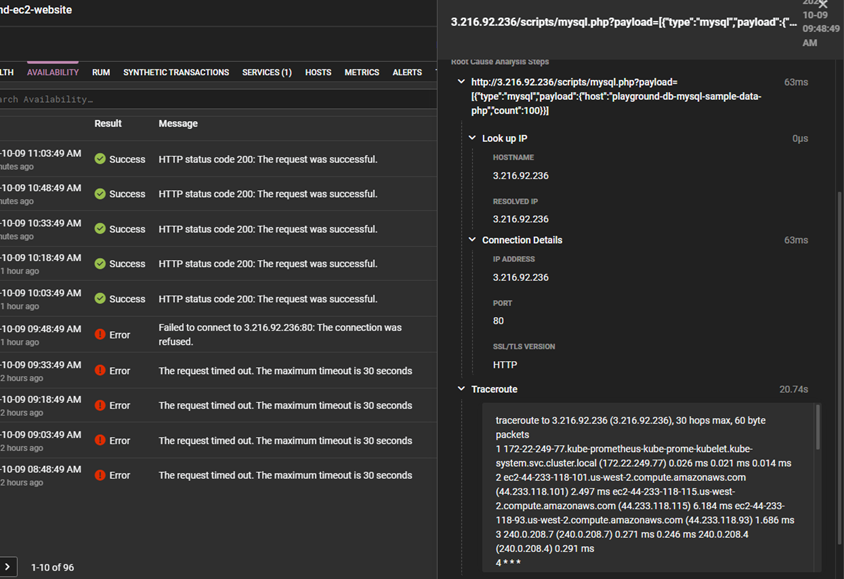
Scrolling through the test results at the bottom of the dashboard, you can click on the failed tests to view the error message, the probe location, and the time stamp. In the same view, the automated root cause analysis details the individual steps of the transaction. From this view, you can quickly determine that the increase in the site response time is due to an issue with a PHP service call to the MySQL database. At the bottom of the root cause analysis view, you can see the entire traceroute of the service call and identify precisely where the connection was refused.
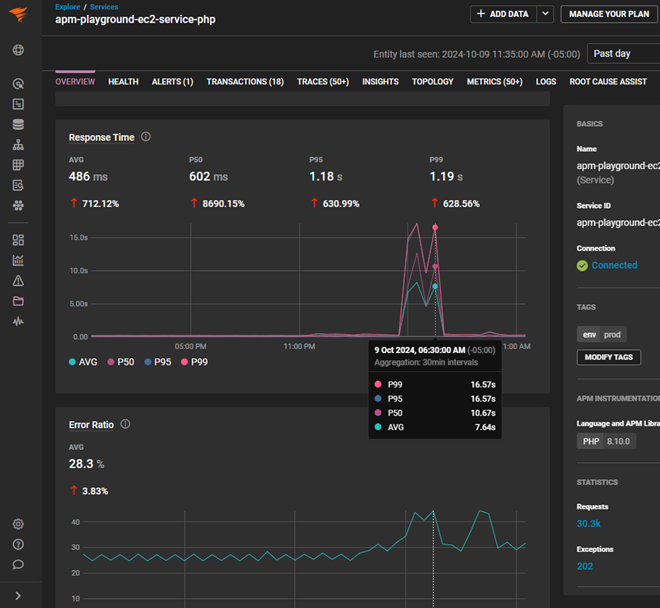
To understand the history of the health and response time of the PHP service, you can select the Services option at the top. In this view, it’s evident that the increase in response time is directly correlated to the increase in error rate. You now have the root cause of your website response time increase.
You can investigate the issue further by selecting the Traces option and choosing a trace from the same period. You can see the MySQL query, perform a code profile, and view the related log events from here.

Digital Experience Observability is much more than availability monitoring. It enables you to quickly triage an alert to determine if there’s an issue. Then, with a series of clicks, it allows you to understand which synthetic transaction is behind the increase in the response rate and identify the poorly performing service call. Deep diving into the poorly performing service, you can run a trace and dig into the specific non-responsive database query or returning an error.
Using the power of a holistic view across your website and all the services, hosts, databases, and networks supporting it, you can get to the root cause of a complex issue in a few clicks—no queries or typing are needed. You can dramatically decrease troubleshooting time and quickly resolve the issue to minimize the user impact.
While Digital Experience Observability might sound like marketing hype, it’s a new approach to website monitoring designed to transform how you understand your website and equip you to deliver exceptional user experiences every time.
To see Digital Experience Observability for yourself, sign up for a free trial of SolarWinds Observability SaaS.