Using the user experience monitoring, application performance monitoring, and logging capabilities in SolarWinds Observability SaaS
Transaction monitoring is the process of observing and recording all interactions within an application, including user-initiated and internal actions. By monitoring transactions in the application, developers can identify and mitigate failures, timeouts, or performance bottlenecks before they cause an outage. Proactive monitoring and timely mitigation ensure an application’s availability and reliability.
Handling a user request is more than a monolithic, singular process. Instead, it involves multiple interactions, such as database queries, API calls, and I/O operations. Correlating these different requests and actions is essential for understanding the complete path of a request from start to finish. This article explores how this monitoring tracks the request flow across different application components, enabling developers to troubleshoot applications efficiently.
Why do you need transaction monitoring in Java?
In a Java application, a transaction typically refers to a series of operations, such as database queries and API calls, executed as a single unit. Monitoring these transactions helps developers ensure optimal performance, stability, and regulation compliance.
Additionally, some applications require strict monitoring of sensitive data handling, including storing and processing. For example, finance, healthcare, or e-commerce applications must comply with GDPR, HIPAA, or SOX regulations.
Transaction monitoring enables teams to track key interactions, such as user actions and data access, providing a detailed history of events and access patterns. These detailed logs can demonstrate compliance with regulations and help identify anomalies—such as unauthorized access or data leaks.
Key components
The key components of transaction monitoring detailed below provide comprehensive monitoring and issue resolution.
Distributed tracing and transaction correlation
In a distributed application, a transaction spans multiple components. Tracing its flow from start to finish allows developers to view the transaction comprehensively. This way, they can correlate requests and actions, enabling faster troubleshooting.
Performance metrics and transaction timing
Monitoring key transaction metrics, such as response time, throughput, and error rate, ensures application health and efficiency. Monitoring such metrics helps you identify and resolve bottlenecks before they affect users. These key metrics can be tracked continuously through dashboards and threshold-based alerts to identify deviations from expected values.
Additionally, transaction timing helps identify inefficiencies by flagging slow processes, such as expensive queries or resource-intensive operations. Developers can track the time taken by each transaction to identify and fix these bottlenecks by updating configurations or adjusting resource allocations.
Error detection and logging
Application logs help developers identify the source of an issue, enabling them to troubleshoot faster. It is crucial to capture meaningful logs for each transaction step, as this allows you to gain insights into events, failures, and timing for every step. In a distributed system—where the application interacts with other systems or microservices—centralized logging makes it easier to correlate and analyze errors across different components.
Alerting
Alerting is critical in bringing together the different components of transaction monitoring. Threshold-based alerts can monitor vital metrics, such as response time, error rate, or resource utilization, enabling teams to react quickly before an outage occurs. With these alerts, teams can maintain high application stability and performance.
Using tools for transaction monitoring in Java
The following tools can be integrated with different aspects of transaction monitoring, such as user interactions, performance metrics, and centralized logging.
Monitoring end-user interactions
How a user interacts with an application provides essential insights into its behavior and performance. Developers can collect contextual metric data, such as response times and errors, to identify issues that impact users, including slow load times and failures.
The digital experience monitoring (DEM) capabilities in SolarWinds® Observability offer real user monitoring (RUM), which provides visibility into end-user activities. RUM enables teams to track performance metrics and monitor application availability across different environments.

SolarWinds Observability SaaS Digital Experience Monitoring
DEM lets you track the success rates of synthetic transactions and provides a historical view for detailed analysis.
Performance monitoring for Java applications
Some key metrics provide insights into the specific performance of Java applications. These metrics include garbage collection frequency, memory usage, the number of active threads, and Java virtual machine (JVM) usage metrics. For example, frequent garbage collection or high memory usage could indicate resource constraints, leading to degraded application performance.
Application performance monitoring (APM) capabilities in SolarWinds Observability enable teams to collect several metrics and provide a unified view of application health, active alerts, and traces.
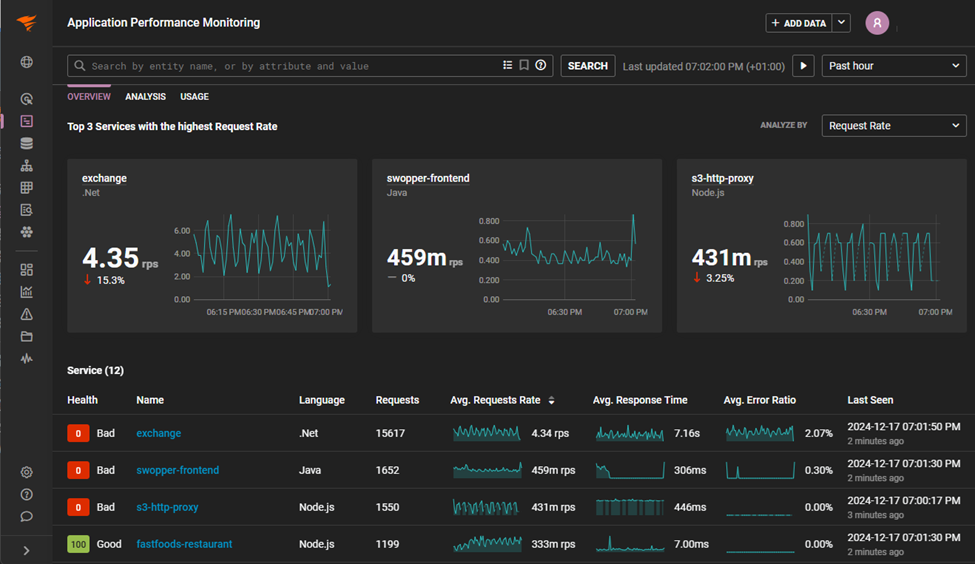
SolarWinds Observability SaaS Application Performance Monitoring
APM allows you to drill down into service-level transactions, insights, alerts, and health, enabling enhanced performance monitoring.
Centralized logging
Centralized logging allows the collection of logs from multiple applications and services into a single platform, making it possible to quickly process, transform, and analyze logs for comprehensive monitoring.
Log exploration and analysis capabilities in SolarWinds Observability allow you to view, search, and analyze real-time logs from different applications in a unified view.
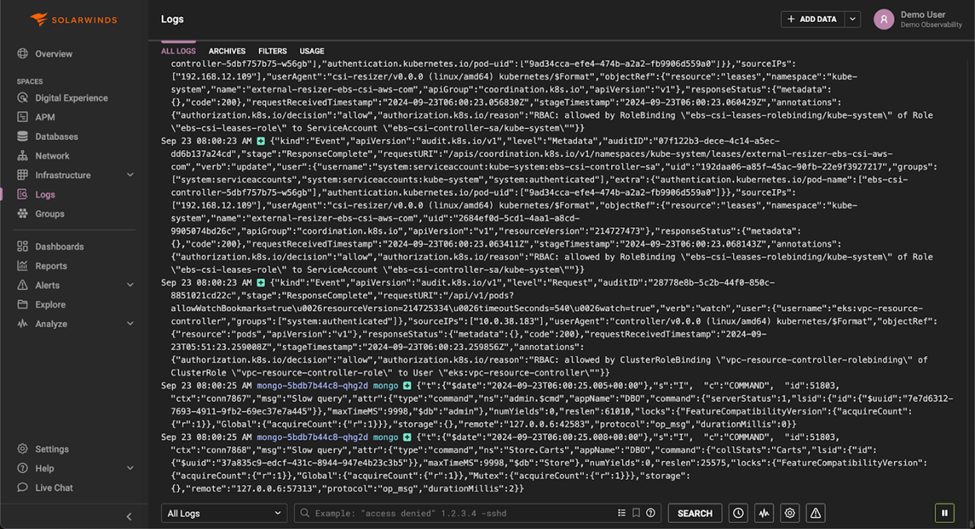
SolarWinds Observability SaaS Logs
You can also search or filter log data and create alerts based on those search queries.
Getting the best results
Adopt a set of best practices to get the most out of transaction monitoring in Java applications.
Java application performance monitoring
Performance monitoring collects metrics, such as response time and resource utilization, providing valuable insights into application behavior. SolarWinds Observability Java Application Performance Monitoring capabilities provide end-to-end monitoring for Java applications by allowing a consolidated metrics view and resource saturation visualizations. As developers collect performance and Java Management Extensions (JMX) metrics for Java applications, they can send them to SolarWinds Observability by integrating its Java Software Development Kit (SDK).
Centralized logging
Integrating with a centralized logging platform enables storage, processing, and analysis of logs under a unified platform. Additionally, implementing distributed tracing allows you to correlate user actions and service interactions, providing enhanced application visibility.
Identifying key application metrics
For efficient application monitoring, it is essential to identify key metrics, such as response time, error rate, heap usage, and active threads. After identifying key metrics, you can set up threshold-based alerts to monitor these key metrics and notify you of anomalous behavior.
Synthetic transaction monitoring
It is crucial to continuously test an application or website from an end user’s perspective to identify issues early. Synthetic transaction capabilities from SolarWinds Observability allow you to simulate fundamental user interactions to help monitor website behavior, performance, and availability.
SolarWinds Observability SaaS for transaction monitoring in Java
SolarWinds Observability SaaS offers a comprehensive solution for monitoring Java applications. It provides developers with centralized logs, detailed metrics, and valuable performance insights.
With the APM capabilities offered by SolarWinds Observability SaaS, developers can track key metrics, such as JVM and JMX metrics, gaining a clear picture of the application’s overall health. Additionally, DEM capabilities in SolarWinds Observability SaaS provide real-time visibility into user interactions, utilizing RUM metrics and synthetic transaction results to monitor end-to-end performance. These features help teams pinpoint bottlenecks and resolve issues swiftly, ensuring a seamless user experience.
Start your free SolarWinds Observability SaaS trial and experience the benefits of transaction monitoring on your Java applications today.