We're excited to announce general availability for version 2024.4 of the SolarWinds® Platform, SolarWinds® Observability Self-Hosted (formerly Hybrid Cloud Observability), and all Network and Systems modules. Version 2024.4 is now available for all customers under maintenance, so log in to your customer portal to download it. Want to see everything new? Check out the Release Notes.
New Features Summary
Here is a quick list of all the significant features, with links to more details on some features.
Hybrid Cloud Observability exclusives:
Hybrid Cloud Observability, Network, and Infrastructure Modules
SolarWinds Platform (available to all products)
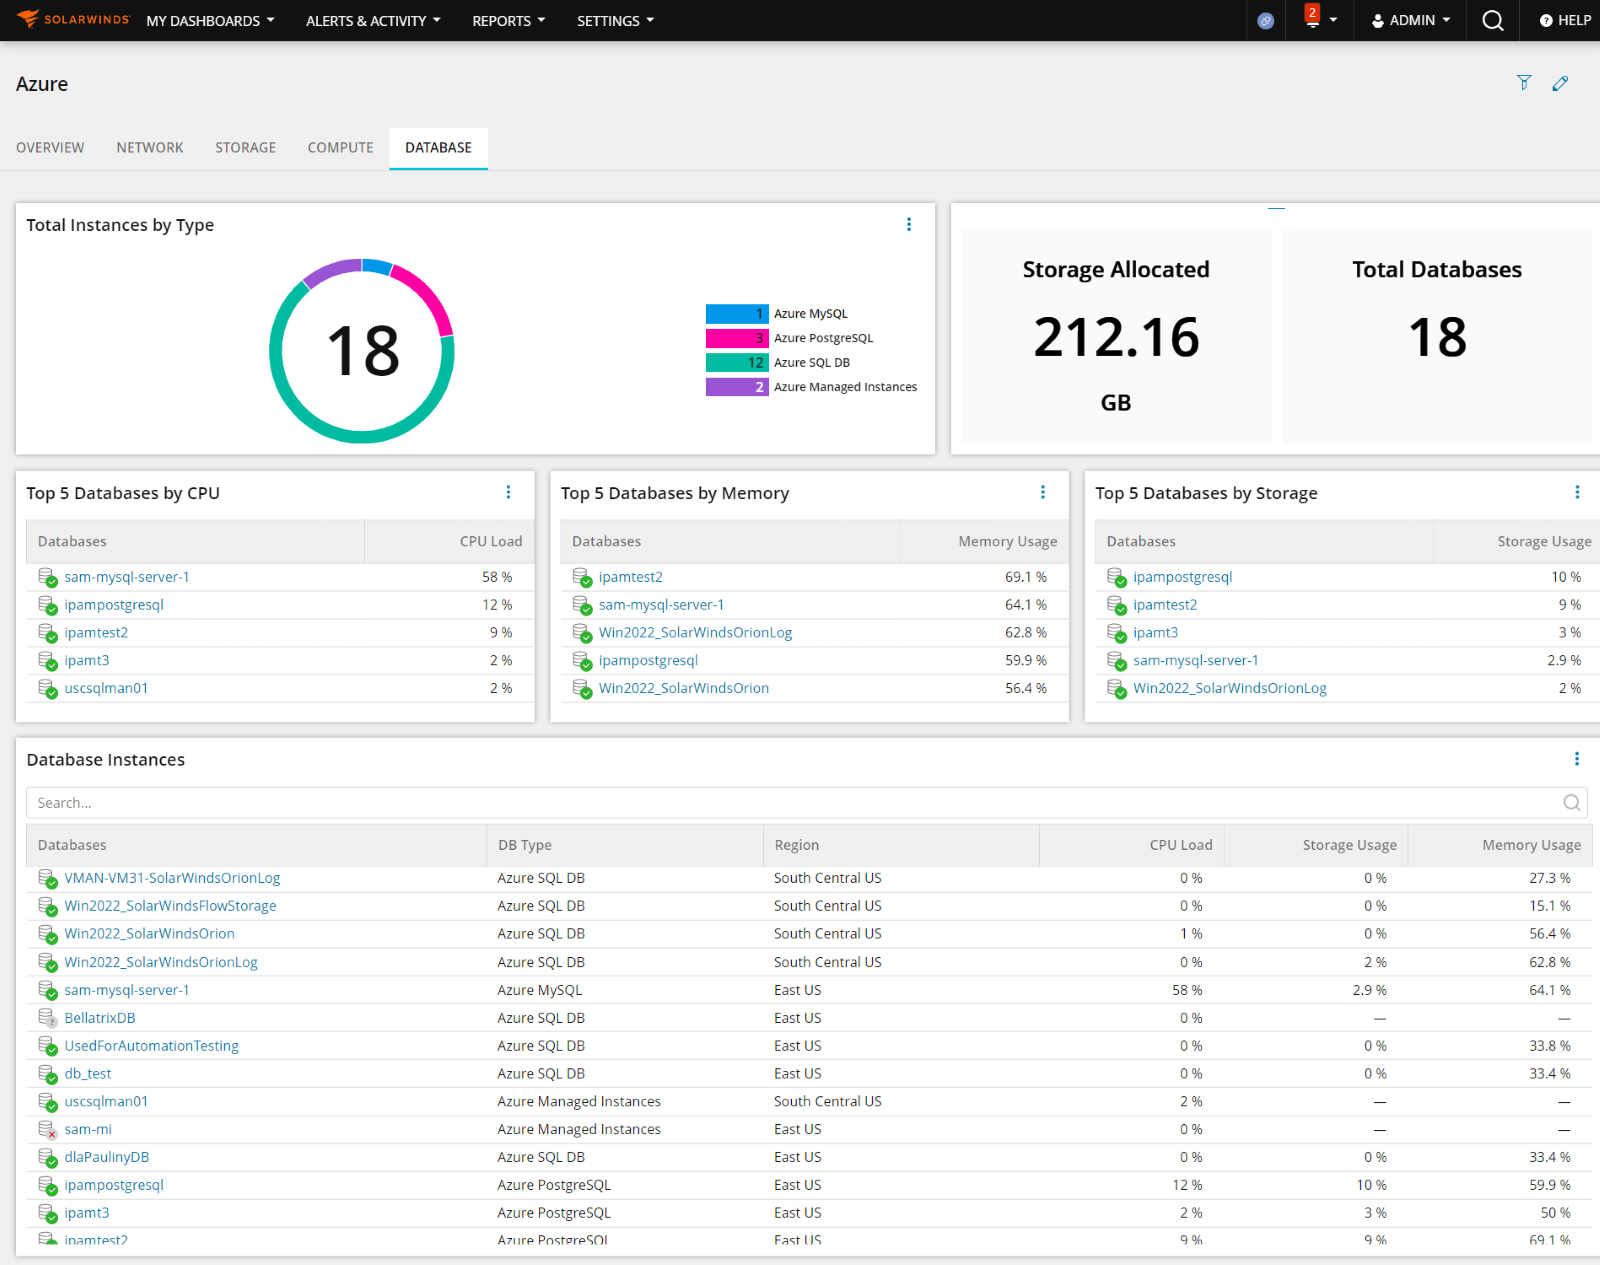
Support for Azure Databases
We have added support for discovering, polling, and monitoring three new Azure databases:
- Azure Managed Instance
- Azure MySQL
- Azure PostgreSQL
This rounds out our database support to four databases in Azure, giving you broad visibility into your cloud relational databases.
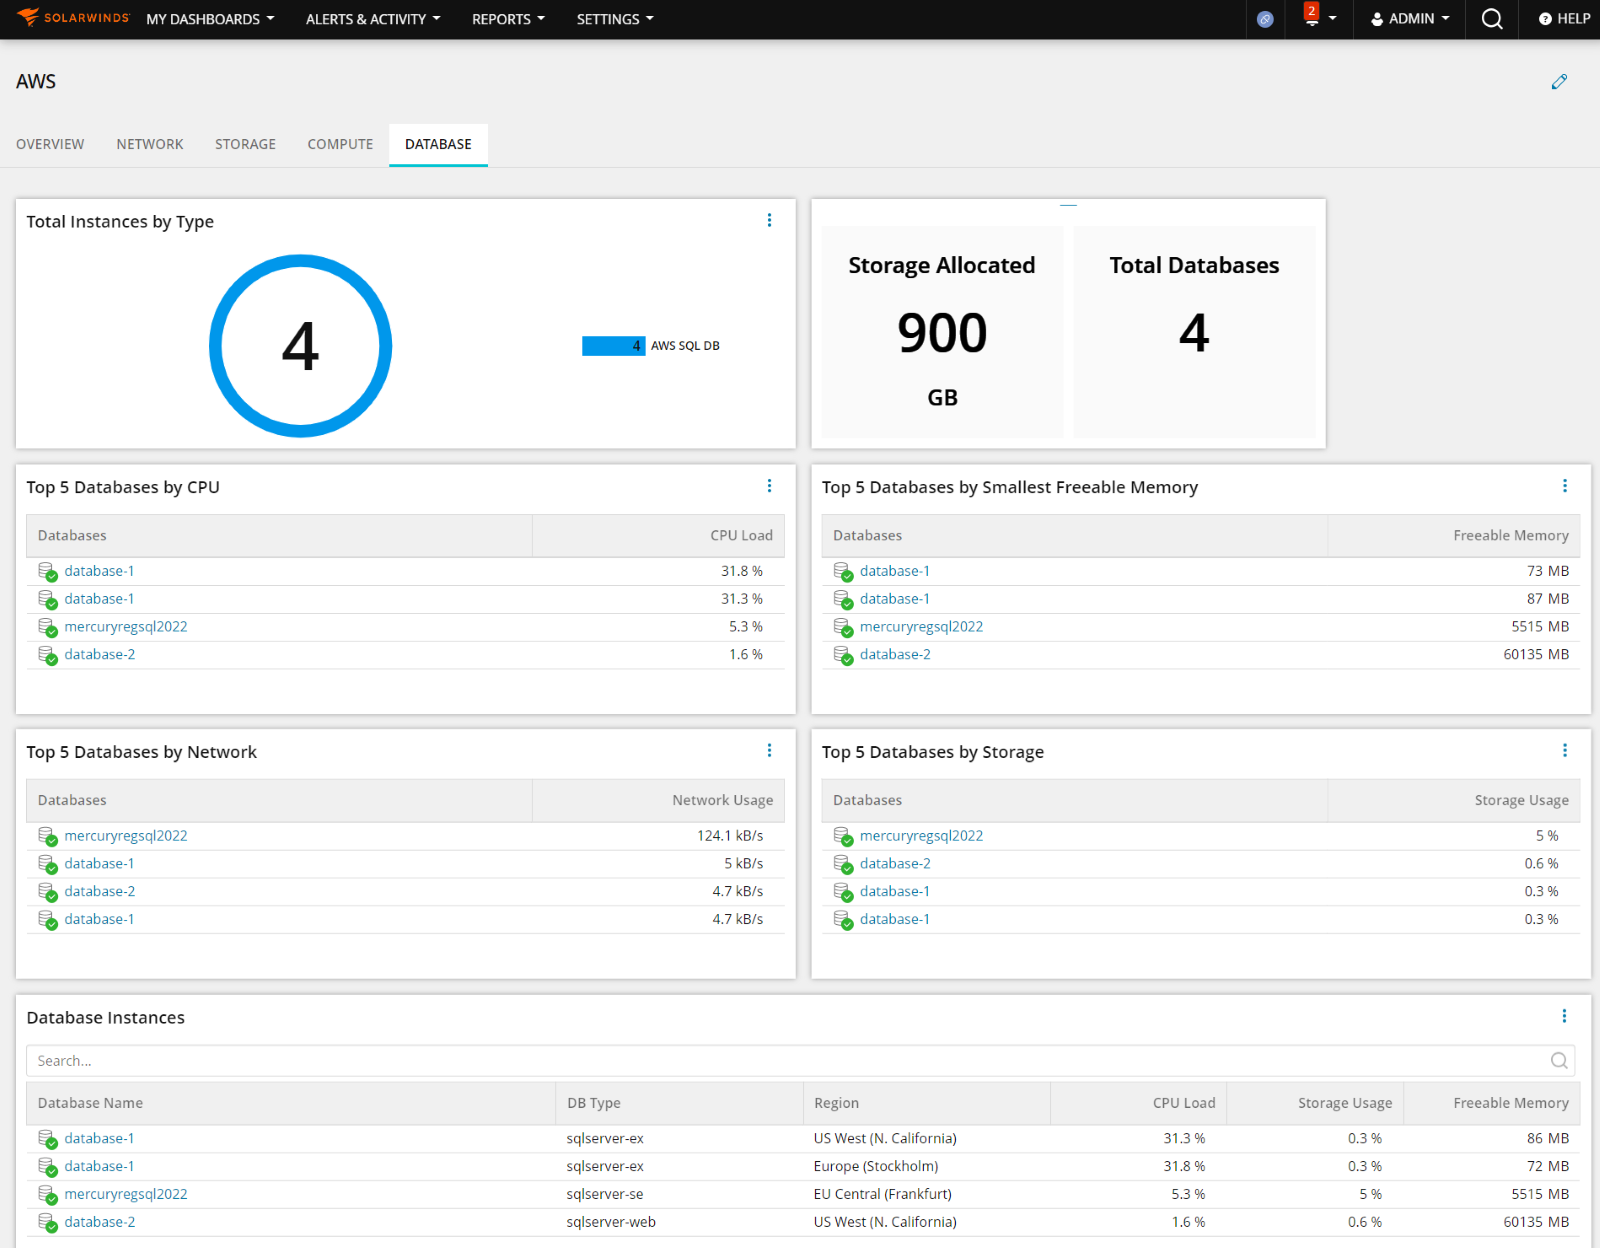
Support for AWS Databases
We have added support for discovering, polling, and monitoring an AWS database:
Scalability for Additional Performance Engines increased by 50%
For Hybrid Cloud Observability products, the maximum scale supported by an Additional Polling Engine has increased from 48,000 elements to 72,000 elements (SNMPv2) on the same hardware, a 50% increase. This improved scalability allows you to deploy fewer APEs in your environment, reducing the total cost of ownership. Note that tests are being run to measure the improvements to SNMPv3 and WMI polling; those results will be added as they are available.
Customers who own modules or Network Automation Manager will see improved resource utilization and better stability when near the maximum number of supported elements.
Vulnerability and Risk Dashboard Improvements
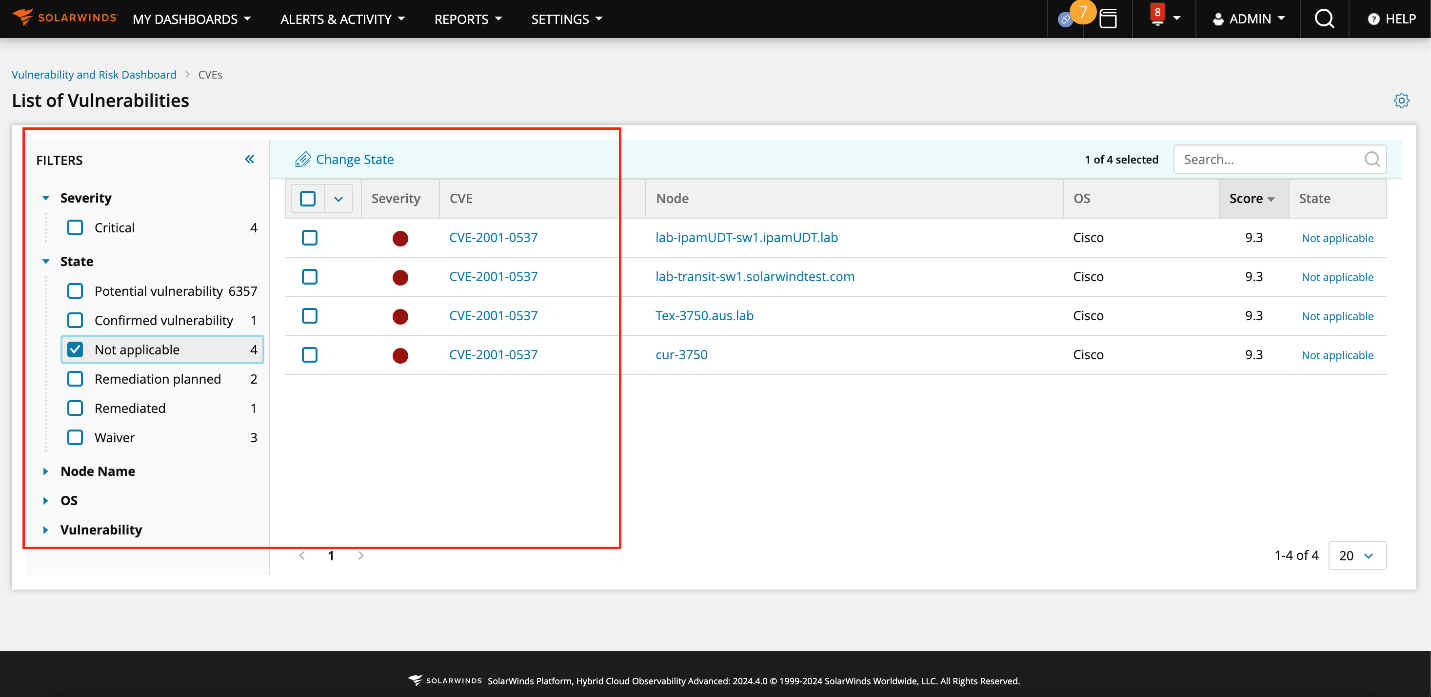
We are excited to improve the vulnerability and risk dashboard by enabling users to change the state of a CVE and its applicability. This feature is available for Hybrid Cloud Observability Advanced customers.
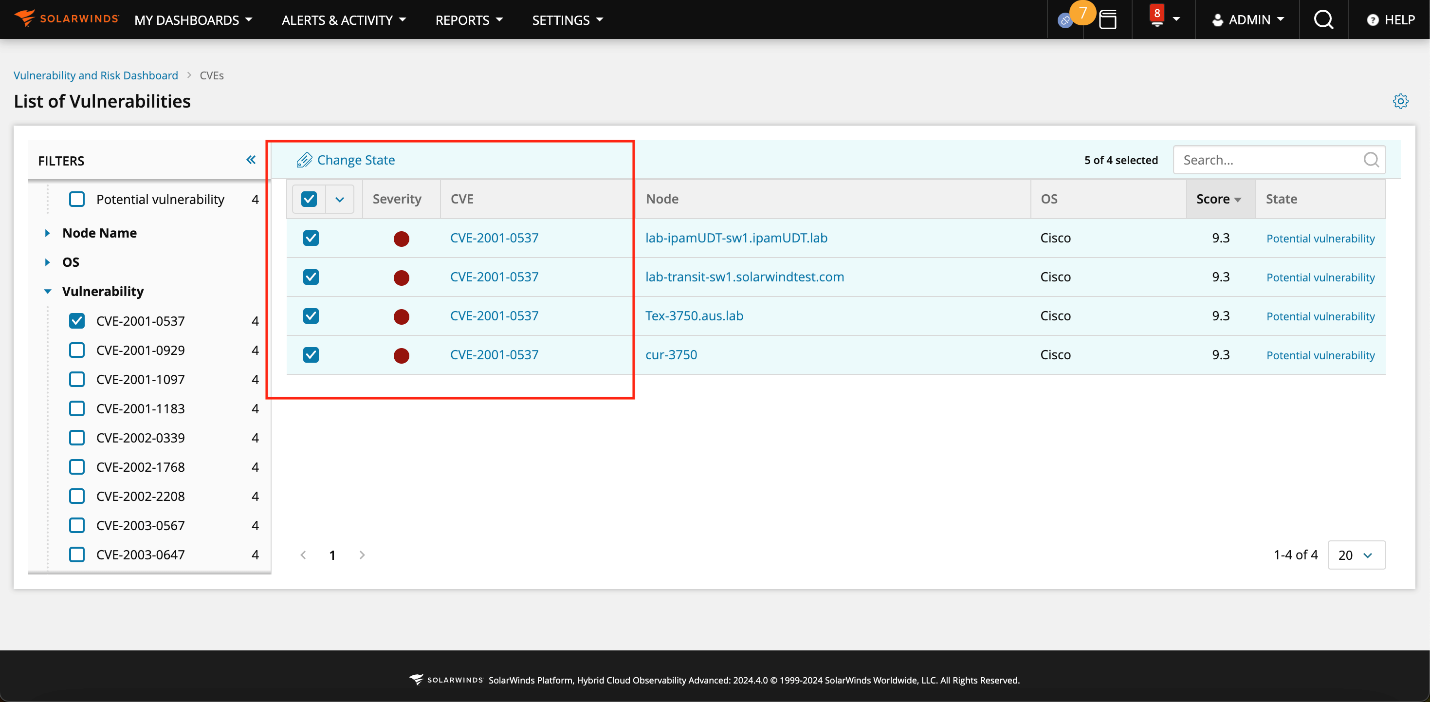
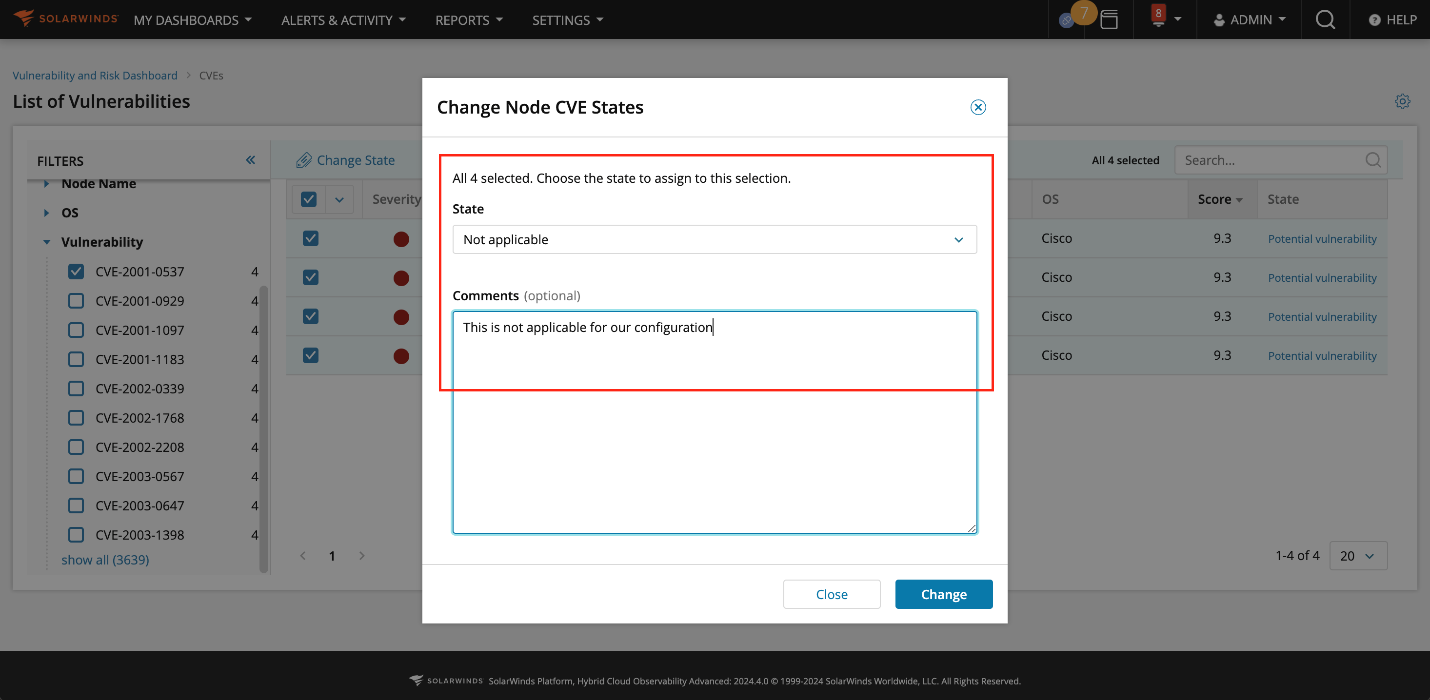
This will help them reduce the noise from the actual vulnerabilities that are of interest. As part of it, we also worked on converging the settings for sourcing and mapping the vulnerability database with the feature in NCM so that customers do not have to do it twice. The state change can also be used as a filter to view the vulnerability details.
Expanded SDWAN Monitoring: Fortinet
Support for SDWAN has been expanded to include Fortinet Secure SD-WAN monitoring of SD-WAN Edge devices and cloud orchestrators using the native FortiOS API.
This update focuses on three key areas: Edge Device Monitoring, Cloud Orchestrator Monitoring, and Tunnel Performance Metrics.
Edge Device Monitoring now provides comprehensive insights into device details, IP addresses, CDP/LLDP data, VLANs, port maps, and uplink performance. Our Cloud Orchestrator Monitoring feature offers real-time status updates, response time tracking, and a complete managed device list. Additionally, we've introduced Tunnel Performance Metrics, allowing you to closely monitor packet loss, jitter, and latency across your network.
These enhancements include proactive issue identification and diagnosis, improved network performance management, and enhanced visibility across your entire Fortinet Secure SD-WAN infrastructure.
Expanding Wireless Network Monitoring
This update brings comprehensive insights into access point details, network-wide client polling, and rogue AP detection for key wireless vendors:
- Fortinet: FortiManager API
- Ruckus: Ruckus One API
- Juniper: Mist API
- Arista: CloudVision API
- Extreme Networks: ExtremeCloud IQ API
Network administrators can now track total APs and clients, monitor rogue AP signal strength, assess controller response time, measure packet loss, and view interface utilization. These enhancements significantly improve wireless network visibility and management across multiple platforms, empowering users to maintain robust, secure, and high-performing wireless infrastructures.
This update enhances wireless network visibility and management across multiple vendor platforms.
Meraki Switches via API
We're excited to announce the expansion of our Meraki API polling capabilities, which now encompass switches alongside our existing SD-WAN and wireless access point monitoring. This update is part of our broader initiative to enhance API-based monitoring for Meraki devices, providing a more comprehensive and efficient network management solution.
The monitoring metrics include important network discovery and segmentation data, including CDP (Cisco Discovery Protocol) and LLDP (Link Layer Discovery Protocol) information, VLAN configurations, and routing table metrics.
This enhancement allows network administrators to gain deeper visibility into their Meraki switch infrastructure without relying on SNMP polling. API-based monitoring provides faster data retrieval, reduced network overhead, and more consistent monitoring than traditional methods.
NAT Stitching for Transparent Network Traffic Observation
NAT Stitching enhancement now observes conversations that traverse through Network Address Translation (NAT) devices, such as routers, security gateways, firewalls, and load balancers. Traditionally, NAT devices obscure the original source and destination IP addresses, making it challenging to track network conversations' true origin and flow.
By leveraging this NAT Stitching enhancement, you can now transparently monitor and report on the full path of your network traffic, ensuring that you have a comprehensive view of the conversations between your internal network and external entities.
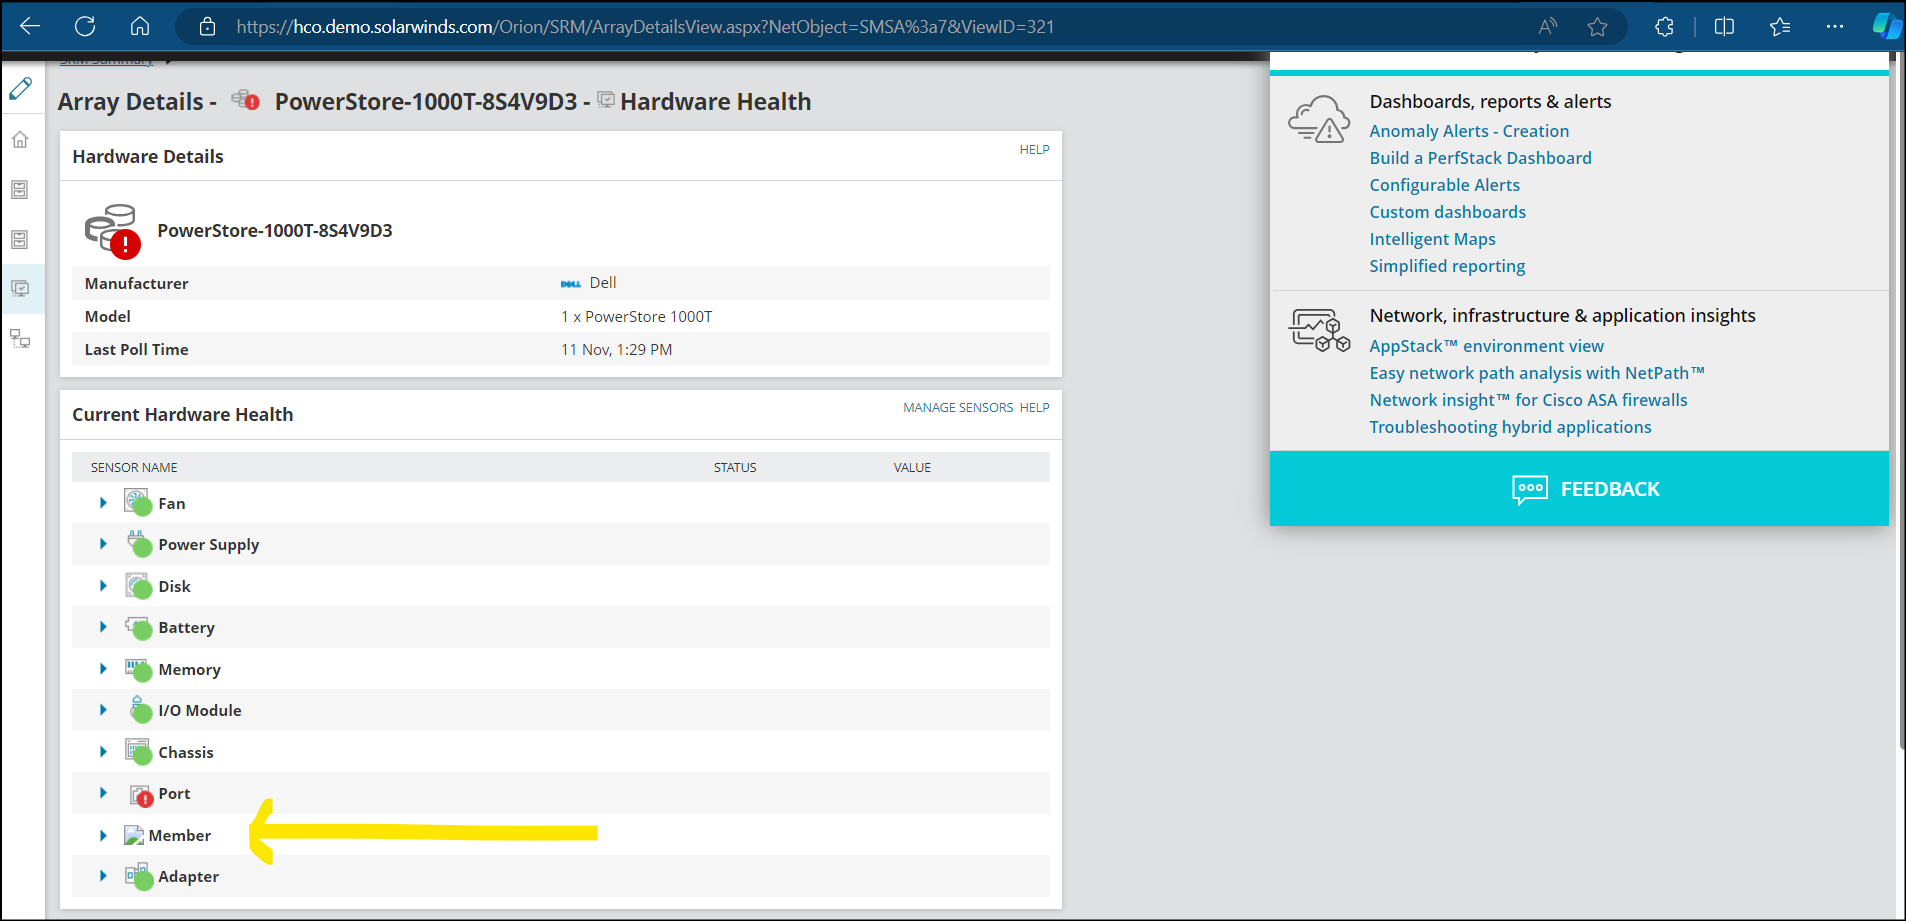
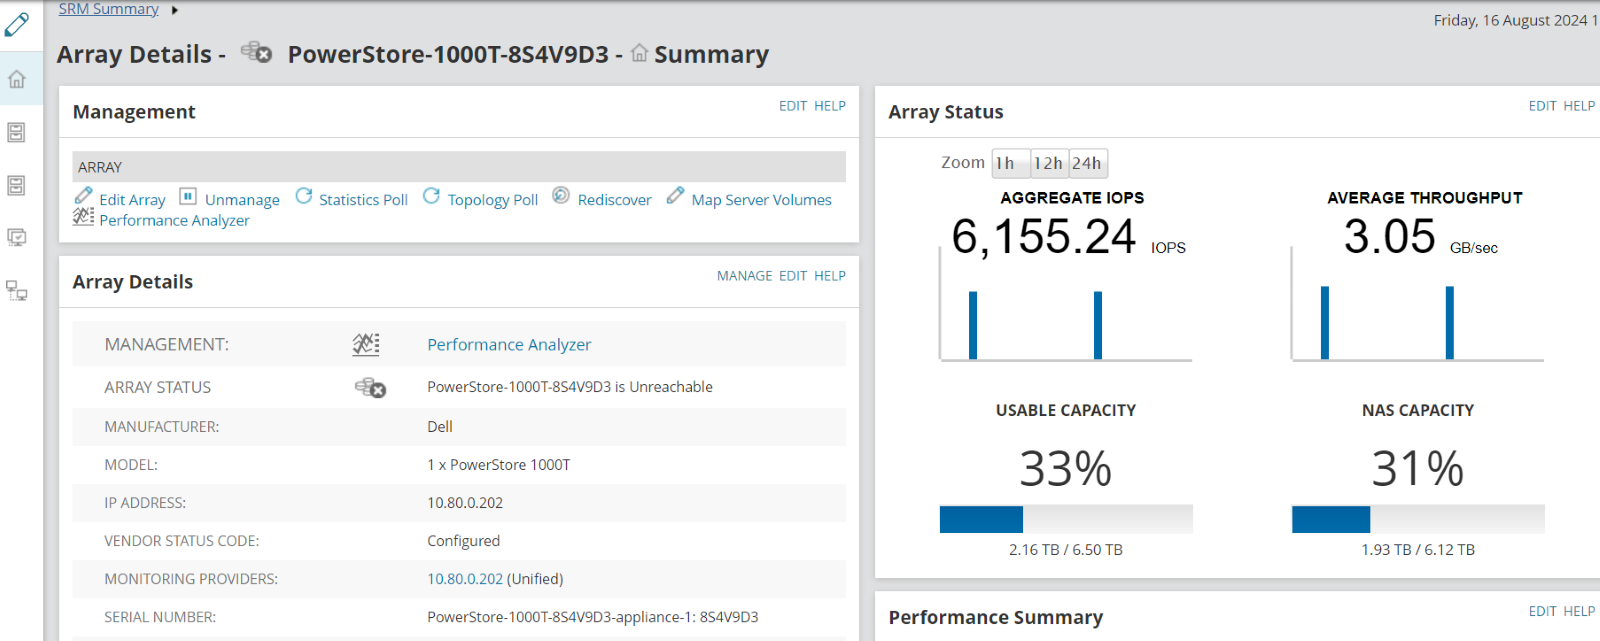
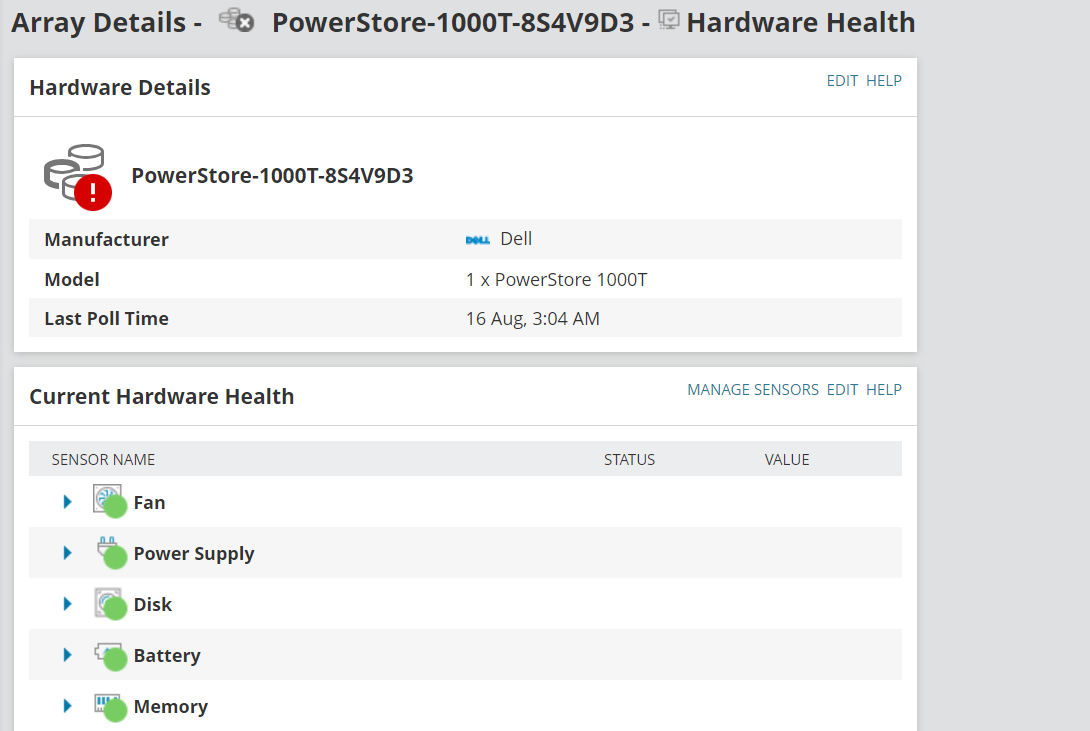
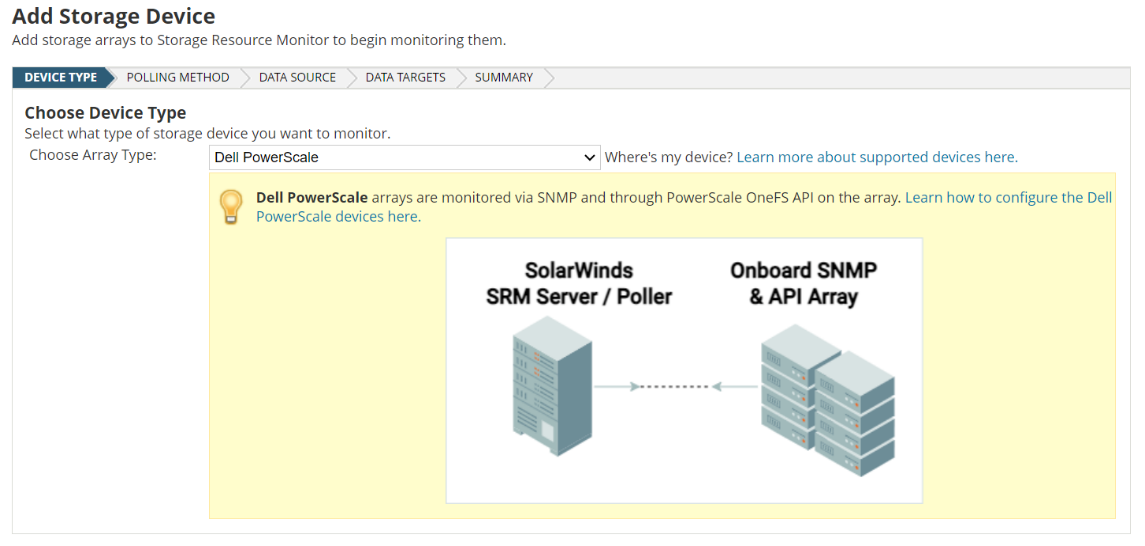
Dell PowerStore T and PowerScale Support
Get capacity, performance, and hardware health data to monitor and visualize the storage that underpins your business-critical applications.
Improved Modern Dashboards
You can now add a horizontal tab bar in any Modern Dashboards. This extends the Modern Dashboard framework and provides more significant insights by allowing you to organize widgets into logical groupings. You can create and define what tabs exist by editing the dashboard, clicking on the Kebab menu, and clicking on 'Edit Dashboard Tabs.' This follows capabilities currently available in classic dashboards where you have vertical tabs on the left.

You can now use the Global Filters Icon to refine the data in Modern Dashboards. Global Filters have been around for a few years, but it requires you to manually update the URL parameters on the page. Now, on a Modern Dashboard page, there is a filter icon on the top right. This allows you to define a set of filterable properties related to that entity. While viewing the page, you can quickly select filters and apply them. Once done, all widgets on the page should be filtered to only the properties you selected. This allows more significant interaction with your data and can quickly help you find pertinent information.

Other notable Modern Dashboard Improvements
- Users can now set a Modern Dashboard as their login page and their default Home Summary Page. When editing an account/group, the Modern Dashboards are listed in the same drop-down menu as the classic dashboards.
- Breadcrumbs are now available on certain Modern Dashboard detail pages. This allows for easy navigation back to the previous page, similar to how it is done in classic dashboards.
Improved Intelligent Maps
We continue to improve Intelligent Maps, focusing on increasing parity with Network Atlas:
- Support for "bendy" multi-point links between objects on the map.
- Bulk clone maps in the UI or via the SDK.
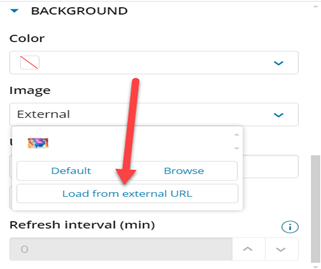
- Support for background images loaded from an external URL.

Security Always
We focus on securely coding, building, and delivering software to you. SolarWinds Aims to Set New Standard in Software Development with Next-Generation Build System. Our choices in forging the SolarWinds Platform align with our Secure by Design philosophy, enhancing our ability to execute this vision now and in the future.
How to Download
The 2024.4 release candidate is a fully tested and supported version and is ready to install on a new server or update your current one.
- For all current Hybrid Cloud Observability customers, the release is available now. You can log in to your customer portal and download it.
- For all current module and bundle customers, the release is available now. You can log in to your customer portal and download it.
- If you don't own Hybrid Cloud Observability but would like to try it or one of its new features, there are a couple of options for you:
- Download a 30-day free trial and install it on a new server.
- If you're a current module or bundle customer, upgrade to 2024.4 first and use the instant evaluation feature to try Hybrid Cloud Observability for 30 days with a click of a button. You can switch back to your modules anytime.
To see everything included in the release, check out the Release Notes.
What's Next?
The 2024.4 release is another step forward, but there is always more to do. Check out our What We're Working On post for what's coming next for the SolarWinds Platform and products.
—The Hybrid Cloud Observability Team