Microservice architectures are everywhere these days. A 2020 survey by O'Reilly reported 77% of businesses have adopted microservice architectures. Internally-written enterprise applications, which have typically been structured as self-contained monoliths, are now being designed using a microservices architecture. A microservice-based architecture, unlike a monolithic application, is made up of a collection of small services/functions (microservices), each responsible for a particular capability.
There are definite advantages to a microservice-based architecture. Breaking an application into discrete, independent services/functions provides a great deal of flexibility and resilience. Specially microservices:
- Minimize the risk of the failure of a single element taking down the entire app
- Enable developers to release updates as features are ready, reducing dependencies and development bottlenecks
- Provide teams with the ability to use diverse languages and technologies without worrying about incompatibilities
- Reduce the scope of testing so many releases do not require full regression testing
Breaking an application into discrete, reusable functions and using a microservice architecture has dramatically accelerated software development and improved flexibility. Developers can independently work on discrete functions, make updates continuously, employ different technology stacks, and easily integrate new technologies. They also minimize the risk that the failure of a single element brings down the entire app.
But all of this flexibility dramatically increases complexity, especially when things go wrong.
Troubleshooting microservice-based applications
In a traditional application, if there’s an exception, you can enable debug logging, recreate the error condition, and search log files to identify event messages indicating error conditions. You can then work backward to identify the root cause.
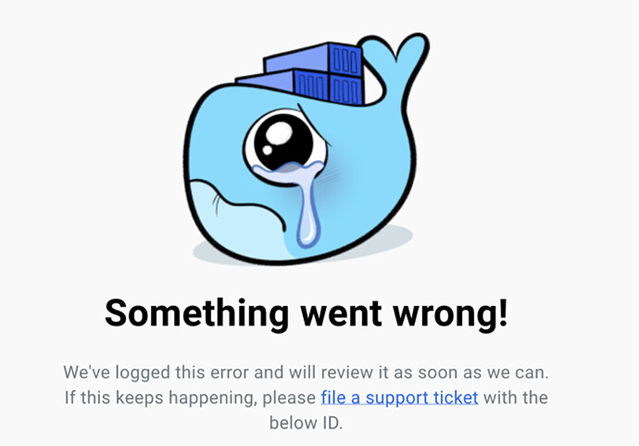
’Something went wrong’ error message in a Docker application
With applications built on microservices, a single request can traverse multiple independent microservices, each consisting of numerous independent and ephemeral services. As a result, you can lose end-to-end visibility of the request. When an application throws an error, your users may see a “something went wrong” message, and you have no idea which service failed and, more importantly, why it failed.
To troubleshoot errors across complex, interdependent, and ephemeral services, like those in a microservices application, you need to be able to correlate multiple isolated events across different services as part of a single transaction. This is where tracing comes in.
Request Tracing in Microservice-Based Applications
Tracing lets you track a single transaction, say a user-generated request, as it traverses the numerous interdependent services the application is composed of. It lets you walk a request from start to end and spot failures. In a microservices-based application, tracing follows the request across the interconnected services in a microservices architecture, which can be useful when trying to understand what went wrong.
The trace ID connects the spans to the request
For example, if a user performs a search for related blog posts in a web application such as THWACK, the web app front-end sends the search request to the content management functions, which identify the matching posts and then send those back to the front-end, which then receives and displays the results. Since the request spans multiple services and resources, tracing follows the request as it traverses functions, APIs, and resources.
To make tracing work, the system generates a unique identifier when the request is received, which is passed to each service. In the past, developers instrumented the trace IDs manually. With OpenTelemetry (OTel), developers can use operators to inject and configure instrumentation automatically. Many observability platforms, such as SolarWinds® Observability, also auto instrument applications using either OTel or proprietary agents.
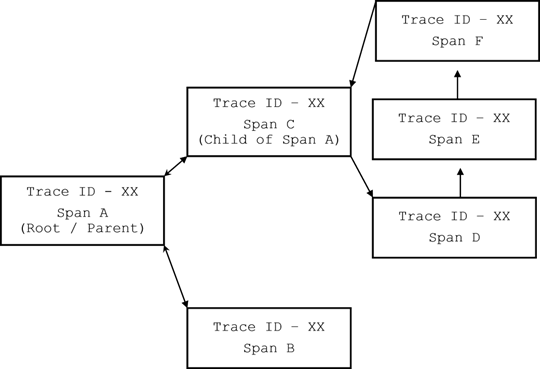
Using auto-instrumentation, the system assigns each request a unique trace ID and each step a span ID. The trace connects the spans and sequences them to represent the request's end-to-end path.
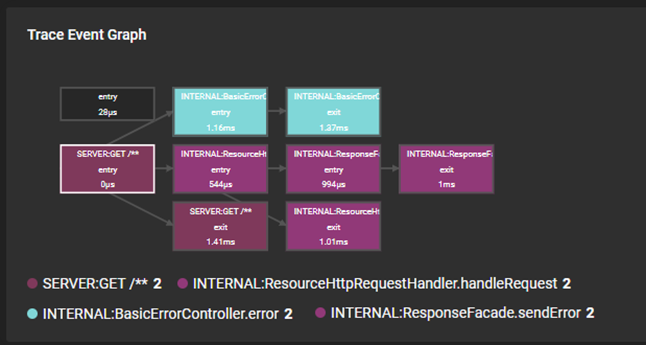
A trace event graph in SolarWinds Observability shows the entry and exit spans.
Using traces to turbocharge troubleshooting
With a holistic observability solution, like SolarWinds Observability, you can use interactive trace visualizations and details to avoid endlessly scrolling through log events, looking for errors, and quickly spot issues and bottlenecks.
For example, if a user reports the search function on a website is taking a long time or is failing to complete, you can open the services overview in SolarWinds Observability and look for changes in duration or error rates.
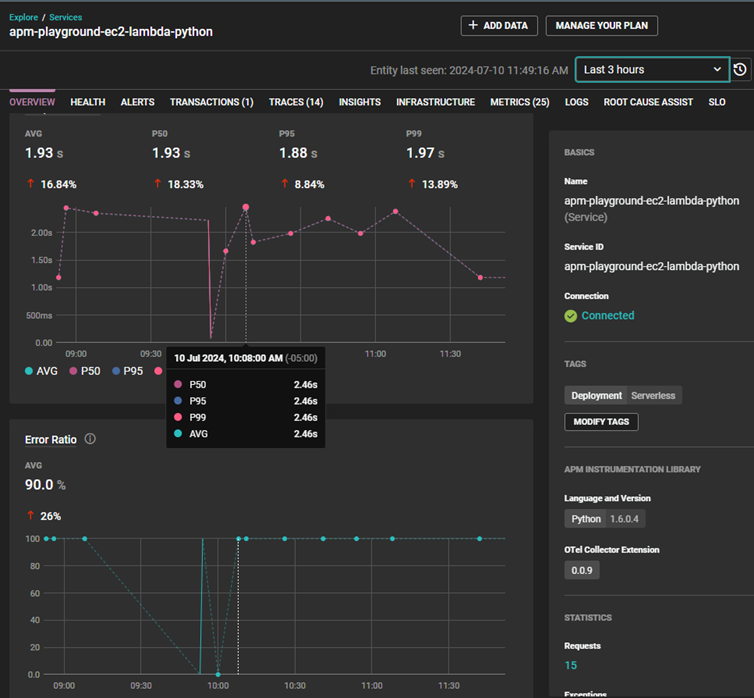
Services Overview in SolarWinds Observability
If you see an increase in the time to complete or in the error rate, you can open the trace view to explore the duration heatmap and identify long pole traces.
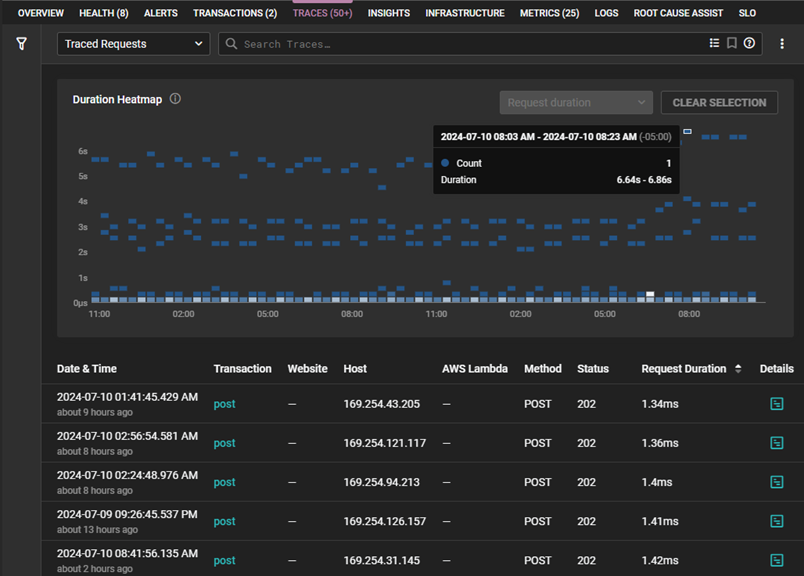
Trace duration heatmap view in SolarWinds Observability
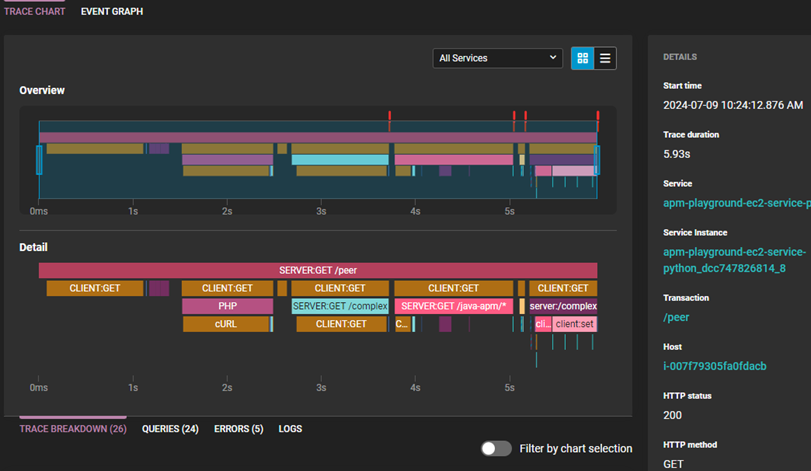
When you identify outlier traces, such as are shown above, you can drill into the details. Selecting the details opens the trace chart which displays the end-to-end trace, as well as the details for each span. With this view, you can spot which spans are causing the delay or generating errors.
To view more details, you can select the span in the chart. By opening the tabs below the span duration, you can drill into the errors, look at the queries, and scroll through event data filtered by the trace ID.
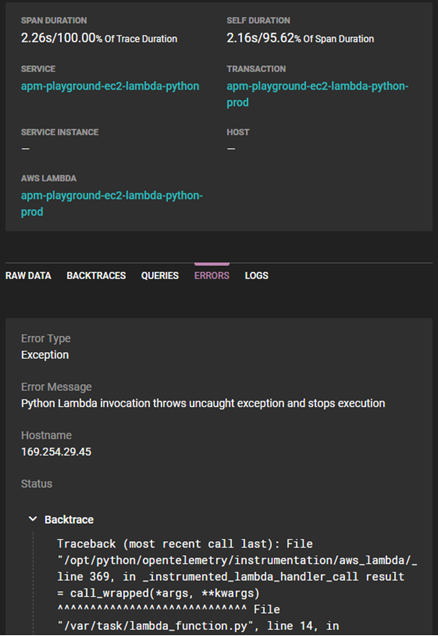
Using the backtrace, query, and log views, you can understand the context surrounding errors or delays and identify the underlying cause of the problem. Traces are also useful when testing different fixes and optimizing workarounds. You can compare error rates and time to complete metrics to ensure the repaired service is working smoothly.
Wrapping Up
An observability solution such as SolarWinds Observability simplifies troubleshooting performance issues in microservice-based applications by allowing you to trace a single request as it traverses multiple services. You can use performance metrics, detailed trace views, backtraces, and context-specific query and log views to pinpoint the root cause of performance problems in complex hybrid and multi-cloud microservice-based applications. If you’re curious, try SolarWinds Observability and see how much easier troubleshooting can be.