Recently, a new customer requested assistance mining data from the SentryOne database to support a daily report that's visible to company executives. The report needed to show the daily average, minimum, and maximum total CPU usage for a specific set of monitored servers for the past 30 days.
Finding the Data
The SentryOne database contains a lot of tables—431 by my count. We need to focus on the few tables holding the data that satisfies our requirement.
Note: The background knowledge needed to build this solution is presented in an excellent six-part blog series by @jason.hall (@SQLSaurus) titled Mining Performance Data from SQL Sentry (Part 1). I won't repeat that information here, so if you're new to extracting data from the SentryOne database, I suggest bookmarking this post, filling your coffee mug, and reading Jason's series first. If you're a little short on time, Mining Performance Data from SQL Sentry (Part 1) and Mining Performance Data from SQL Sentry (Part 5) are most relevant to our conversation today. Moving ahead, I'm assuming you have digested the information in at least part 5 of Jason's blog series.
Let's begin by restating the business problem as technical requirements:
- 3 aggregations (average, minimum, maximum) of a single performance metric: Percent Processor Time
- Each aggregated value must cover a full day
- Values are required for the past 30 days
- Values are needed for a defined set of monitored servers
Next, we determine which tables hold the required data in the SentryOne database:
- Monitored server data is stored in the
Device table - Collected performance counter values are found in the
PerformanceAnalysisData table. As this data ages, it's aggregated into a series of PerformanceAnalysisDataRollup tables (see Jason's post for a full explanation). The rollup tables include average, minimum, maximum, and standard deviation values for each performance counter.
The best rollup table for our use case is PerformanceAnalysisDataRollup14 because it stores the most granular data for the prior 30-day time range we need. There's a row for every 2-hour interval.
Column PerformanceAnalysisCounterID in the rollup tables is an identifier of the performance metric in each row of the table. We identify the CounterID we need using the following query:
SELECT c.ID
     , c.CounterName
FROM dbo.PerformanceAnalysisCounter c
INNER JOIN dbo.PerformanceAnalysisCounterCategory cc
     ON c.PerformanceAnalysisCounterCategoryID = cc.ID
WHERE c.CounterResourceName = 'Percent_Processor_Time'
     AND cc.CategoryResourceName = 'Processor_Information' --CPU counter category for Windows 2008 and higher
My blog post I Didn’t Know It Could Do That! Enabling Additional Performance Counters includes all the queries you need to explore the performance counter data SentryOne collects.
The Solution, Explained
Now we're ready to build our solution. One of the many advantages of working at SentryOne is having access to all the SQL Server experts on staff. For this solution, I scribbled out an IOU and asked our resident T-SQL guru, @AaronBertrand (@AaronBertand), to review the code I wrote to solve this problem. He graciously set aside my approach and wrote the solution below. (Thanks Aaron!) Let's look at our Aaron's solution and dissect it.
-- ===========================================================
-- Return daily AVG, MIN, MAX %_Processor_Time for
-- a defined set of monitored servers over the last 30 days
-- ===========================================================
DECLARE @NumDays INT = 30;
DECLARE @StartDate DATE = DATEADD(DAY, 1 - @NumDays, GETUTCDATE());
-- to not include today in start date change 1-@NumDays to -@NumDays
DECLARE @StartTS BIGINT = dbo.fnConvertDateTimeToTimestamp(@StartDate);
-- already UTC
DECLARE @Device TABLE (
     DeviceID INT
     , ObjectName NVARCHAR(640)
     );

-- table variable to hold list of monitored servers
INSERT @Device (
     DeviceID
     , ObjectName
     )
SELECT ID
     , ObjectName
FROM dbo.Device
WHERE ObjectName LIKE N'YourServerNamePattern%'

; WITH TimeSlot (Slot)
AS
     -- First CTE: Generates a table of time slots. In this case 30 days:
     (
     SELECT 1

     UNION ALL

     SELECT Slot + 1
     FROM [TimeSlot]
     WHERE Slot < @NumDays
     )
     , StartTS (
     Slot
     , StartTS
     )
AS
     -- Second CTE: Add the timestamp value for the beginning of each day:
     (
     SELECT Slot
          , @startTS + (17280 * (Slot - 1))
     FROM TimeSlot
     )
     ,
     -- determine start range of each slot, in TS, not datetime
AllTS (
     Slot
     , StartTS
     , EndTS
     )
AS
     -- Third CTE: Add the timestamp value for the end of each day:
     (
     SELECT Slot
          , StartTS
          , EndTS = StartTS + 17280
     FROM StartTS
     )
SELECT [Day] = DATEADD(DAY, ts.slot - 1, @StartDate)
     , [Server] = d.ObjectName
     , CAST(AVG(r.Value) AS DECIMAL(5, 2)) AS AvgCPU
     , CAST(MIN(r.MinVal) AS DECIMAL(5, 2)) AS MinCPU
     , CAST(MAX(r.MaxVal) AS DECIMAL(5, 2)) AS MaxCPU
FROM AllTS AS ts
CROSS JOIN @Device AS d
LEFT JOIN dbo.PerformanceAnalysisDataRollup14 AS r WITH (NOLOCK)
     ON r.StartTimestamp >= ts.StartTS
          AND r.StartTimestamp < ts.EndTS
          AND r.PerformanceAnalysisCounterID = 1858 -- PERCENT_PROCESSOR_TIME
          AND r.InstanceName = N'_Total'
          AND r.DeviceID = d.DeviceID
GROUP BY ts.slot
     , d.ObjectName
ORDER BY d.ObjectName
     , ts.Slot;
The first 3 lines of code declare and populate variables we will need later—the number of days in our date range, the beginning datetime in UTC (because this is how datetime values are recorded in the SentryOne database), and the start datetime converted to our custom implementation of a timestamp because, again, that's how it's stored.
The next two statements declare a table variable to hold the set of monitored servers we want performance data for, and an INSERT statement to populate the table variable with a filtered data set from the Device table. Our example is a simple filter based on a pattern against server name, but there are many possibilities for building a filter based on other criteria.
Next, we use three CTEs to build a rowset with the day number (1 - 30), which I'll call a slot, and the start and end timestamp for each day. Here's an example of the output:
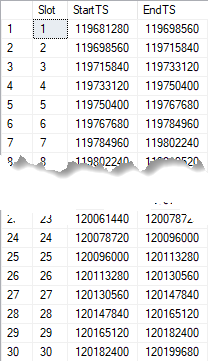
Truncated output of the CTE AllTs
Finally comes the main query that joins the third CTE to our @Device table variable and our rollup table. We filter on start and end timestamp, counter id, and counter instance. Grouping by AllTs.Slot and ObjectName gives us a result set for each day and server. The example below is for a 10-day time range:
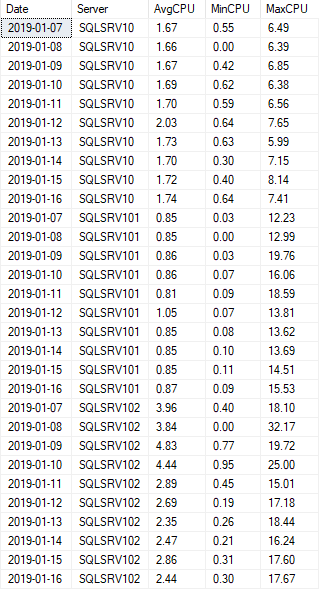
Sample output from the query using a 10-day range
Note that our SELECT list includes AVG, MIN, and MAX aggregations for the Value, MinVal, and MaxVal columns in PerformanceAnalysisDataRollup14. This table stores 12 rows of data per day for each device and counter combination, so we have to aggregate those values again to obtain values for each day.
So, there's our solution. We could have built a more generalized version that would return results for any time range; however, it becomes more complex, requiring the use of dynamic SQL to determine the correct rollup table. This is exactly what SentryOne does to return data for the Performance Analysis dashboard and reports!