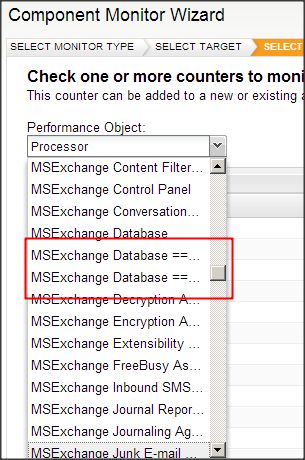
While using the Component Monitor Wizard with Performance monitor objects (for example), many of the objects in the Performance Object drop box are cut off, making it impossible to know if you're selecting the correct object. Please add the horizontal scroll bar so that objects aren't truncated,.
For example, in the screenshot below, which of the MSExchange Database counters are indicated with "=="? Page Fault Stalls/sec? Log Record Stalls/sec? Version Buckets Allocated?