Problem Statement:
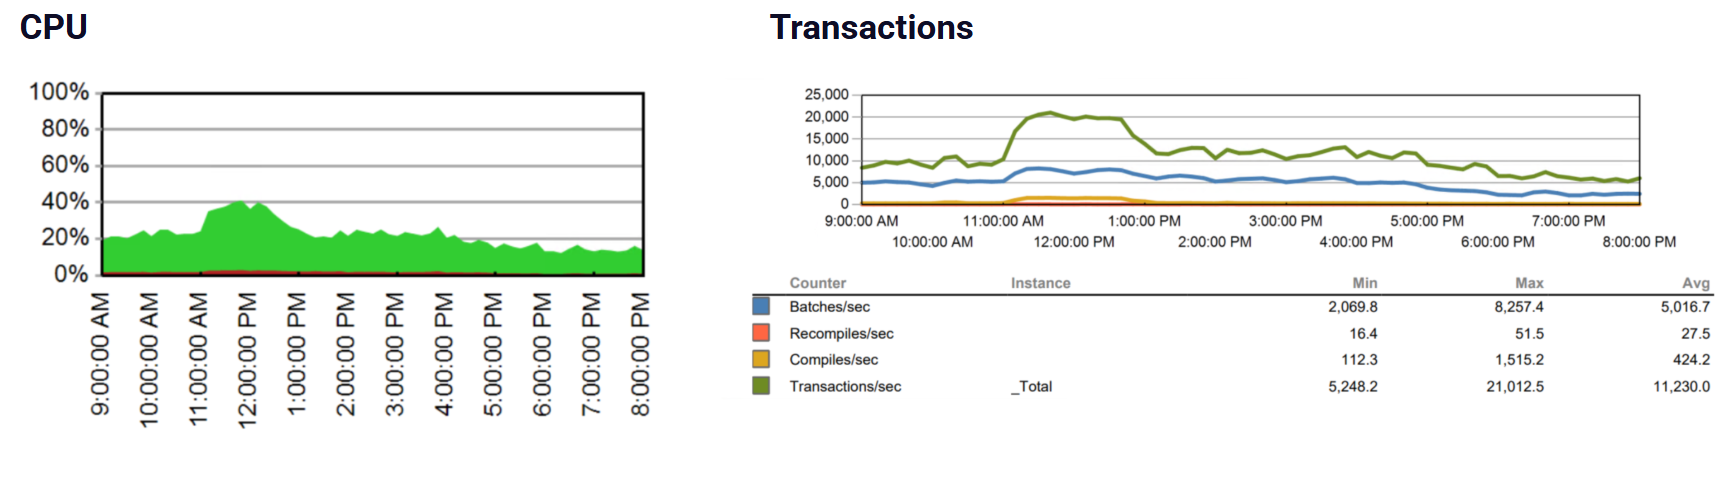
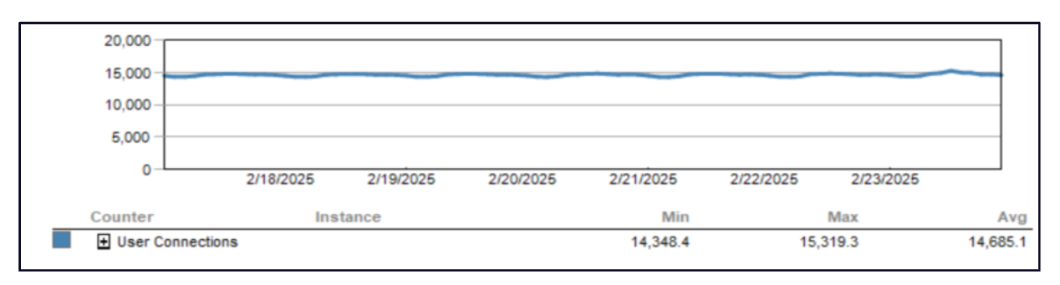
When Investigating an Incident historically, it was identified that transactions increased by 10,000 and in turn increased CPU, while connections remained steady
In TOP SQL I was not abled identify the root cause as the user and application of all the queries were faster than the minimum duration (00:00:00.100) therefore not captured.
Support advised, there is nothing that can be done within Sentry as of now.
Outcome:
We should capture the information related to transactions regardless if they are faster than the minimum threshold set. Even if it is at a high level view of User, Application & Host which will help us get to the problem a lot quicker than using 3
different monitoring tools.
Analysis performed to identify this not working:
When Investigating an Incident historically, it was identified that Transactions increased by 10,000 and in turn increased CPU, while connections remained steady (as per image below).
Opening TOP SQL there was no way to identify which user/host/application was the cause of this. I needed to go via Query Store & another monitoring solution to retrieve the answers.