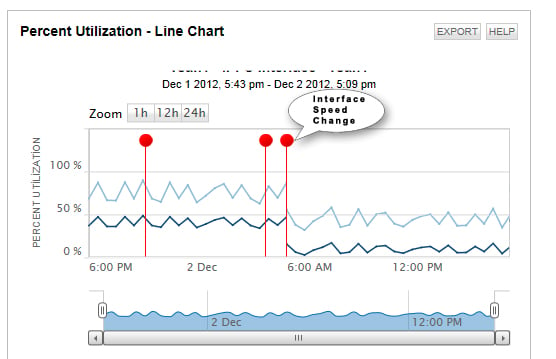
Hello All,
We always make changes on our environment. We make changes on Network devices, Servers, appliances, softwares, etc. Some of them are major, some of them are minor. Sometimes these changes break something and we miss the problems in that time. We realise this problem after a week maybe. Then we forget what we change 
The idea is "Major change bubbles on charts" If there is a special console for nodes or softwares as custom properties(but this information will be stored as historical), we can type changes via this console but the key parameter is that we see these changes on charts like bubbles with right time information
When we click on a bubble, we can see the change's detail. so when we see an abnormal trend(increase or dicrease) on charts, we will see the cause of problem on same change.
Regards
