When using the time series widget with the modern dashboard pulling in a perfstack model it seems to show in bps on the modern dashboard whereas on in perfomance analysis it converts to mbps. Can we get the same behaviour within the modern dashboard timeseries widget.
Examples:
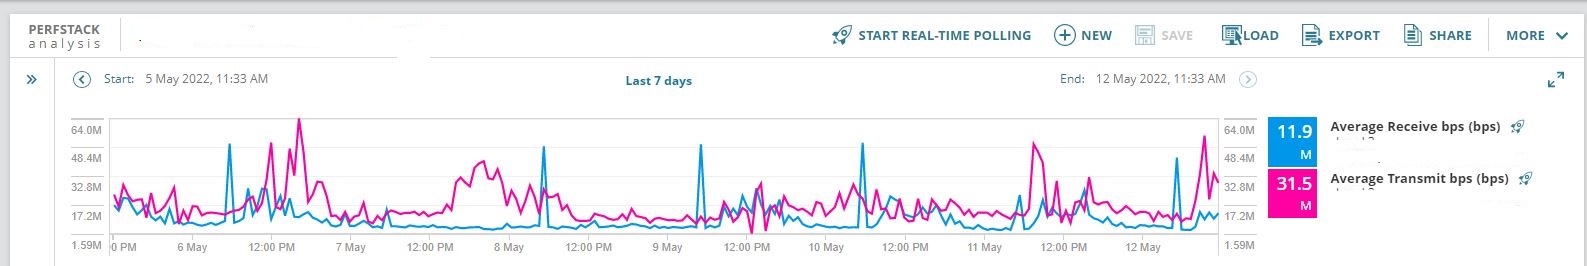
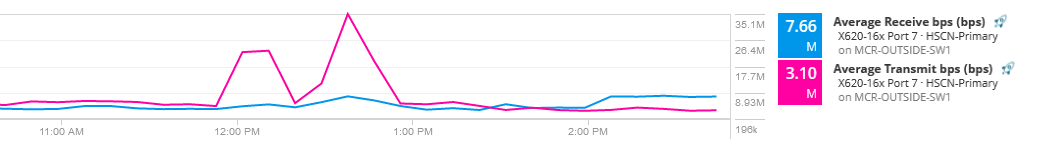
Within Perfomance Analysis:
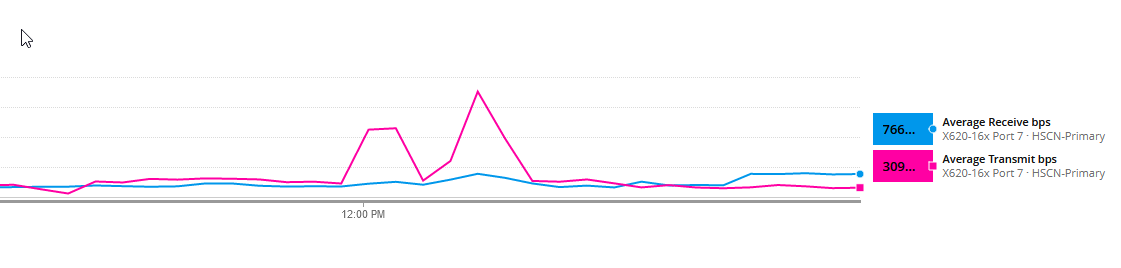
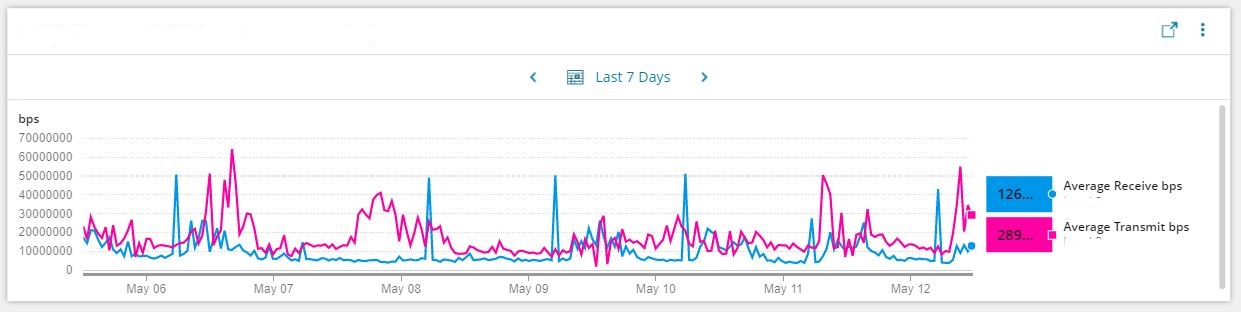
Within Modern Dashbaord timeseries widget: