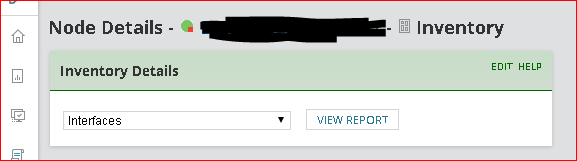
When I browse NPM for Node Details on a specific switch, I can choose the Inventory tab and select the Interfaces option, and click View Report.
The page that opens shows all the Interfaces, and on the upper right area there's a dropdown to search for Interface, Interface Type, Interface Alias, or IP Address--and there's a window to the right of that to allow me to search all rows.
I'd like to search all rows for column content that is NOT Interface, Interface Type, Interface Alias, or IP Address.
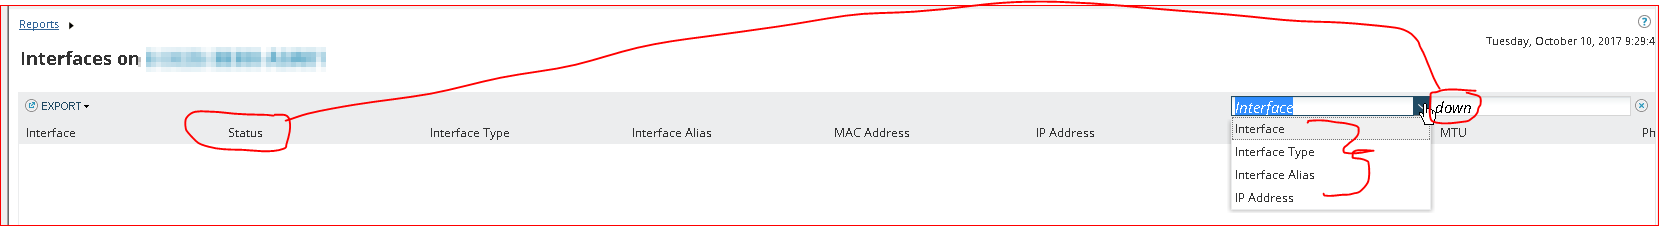
For example, I'd like to search or sort by Interface Status, and show all the ports that are Down. But that's not working with this report--Status isn't one of the options.
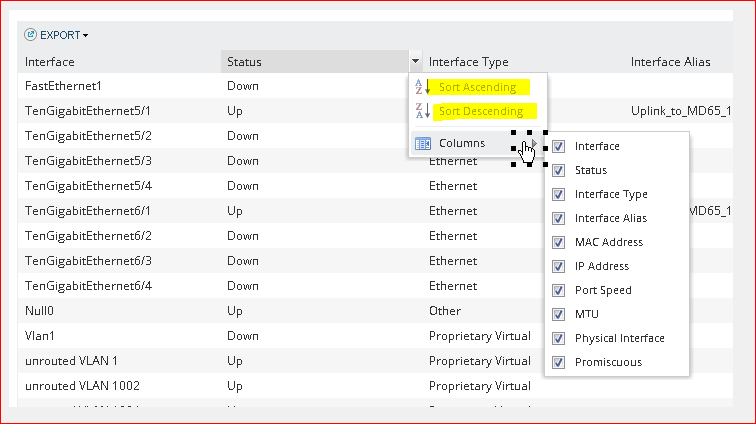
So I thought I'd be able to just click on the columns and sort Ascending or Descending--but that option's grayed out--unavailable:
It appears I can export this report to Excel; from there I could sort & filter. But isn't that what the two dropdown windows in the report are for?
I'd like this report to be modified to let me search for anything in any column.
And, perhaps best--I'd LOVE for this report to include a column showing how long any interface has been down!
Vote it up, please!