I am referring to the new HTML5 UI here, just to be clear.
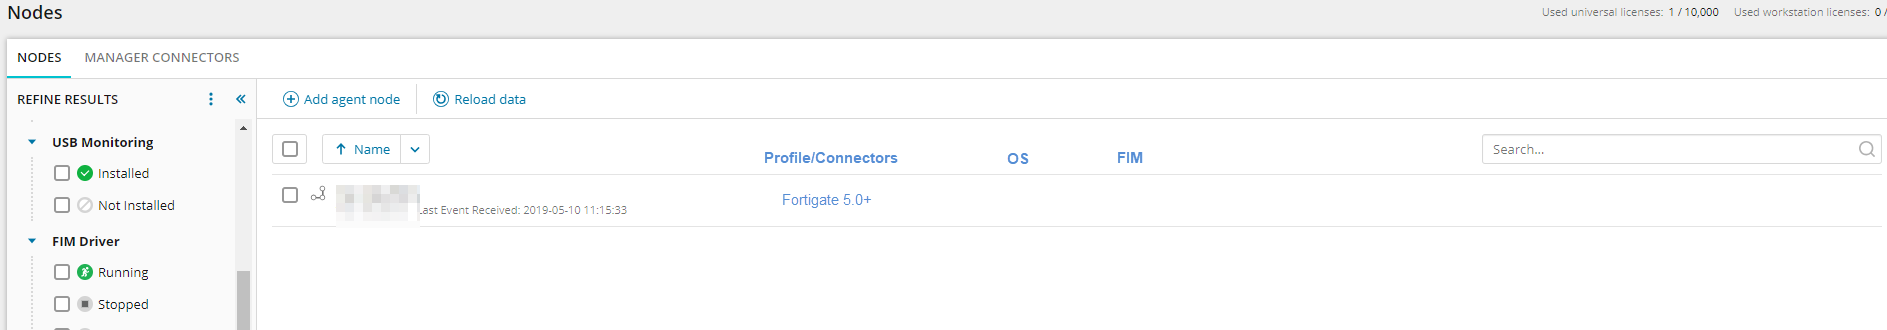
Within the Node list, the IP/Name of the node sending log data to SEM is displayed. What I would like is for each line entry to include detail on what connectors are being used to process the log data. This is useful to allow understanding of how the log data is going to be processed and where common connector issues can be seen across multiple devices.
I know in the old flash UI, there was a column for Profile, which was OK, but meant you had to then navigate through to the profile to see what connectors formed that profile. Extending this to display connectors would be useful and also extending to Syslog sources is requested.