Hi Team,
When working with volumes over 1tb only one decimal point of information is presented on graph mouseovers, this can be quite annoying to work with:
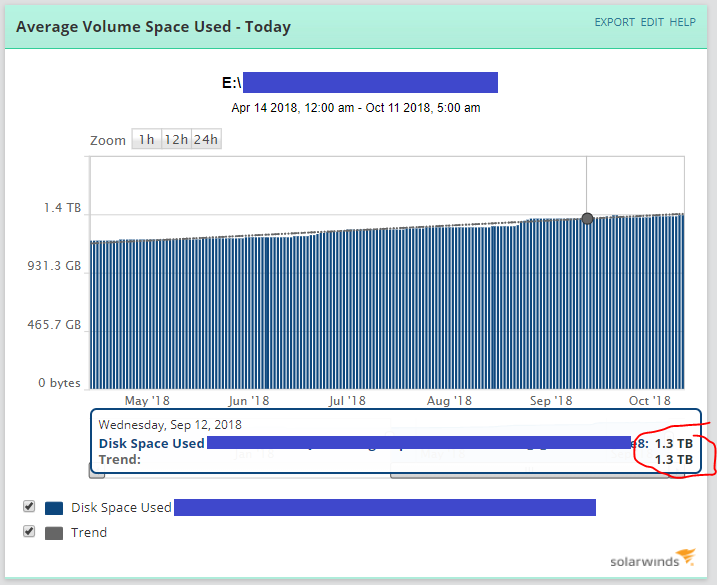
The data can still be gathered from the DB, and you can get an extra decimal point from perfstack-style elements, however spinning up a new element/report is a long workflow
Possible improvements:
- Add 1 or 2 more decimal points for TB formatting
- Add an element on charts for custom axis/mouseover units formatting
- Add an element on views or accounts for units formatting
- Remove TB rollup (not a fan of this)
- Add a value on chart elements for net growth between the start and end of the viewed data, give a detailed value
Anything equivalent is fine by me!