I would really like to see an ability to see all the details about Thresholds in website widgets associated with objects whether they be Nodes, Interfaces, SAM Component Monitors, etc. Where we do see Thresholds displayed, here-and-there, but you only see the associated Threshold Number and not the other details.
In a SAM component, for example, you see something like:
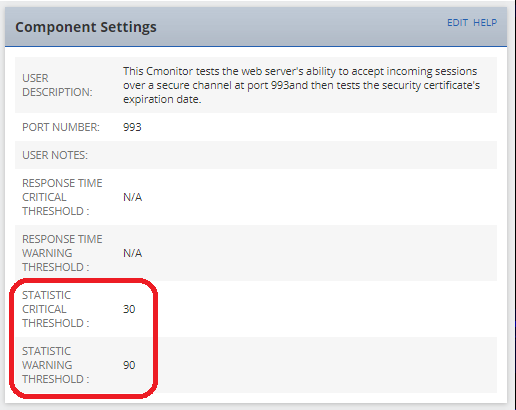
...even though the settings in the Component Monitor itself show:
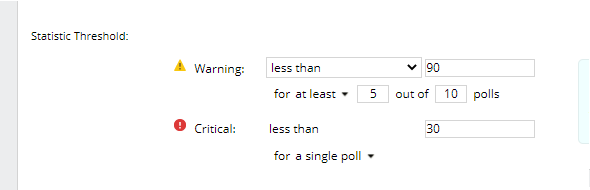
The "for at least 5 out of 10 polls" is completely missing which leads to the widget display incomplete information. IMHO: Not showing it at all would be better than just showing a portion of it. But our Teams need to see the whole setting to fully understand what is going on.
Displaying the Full Thresholds can even be abbreviated like:
- [W=2in6of10polls,C-NotSet] - meaning if equal to 2 for 6 out of 10 polls trigger Warning Event and Thresholds are not set for Critical.
- [W<=90in1poll,C<30in5polls] - meaning if less than or equal to 90 for a single poll trigger Warning Event and if less than 30 for 5 consecutive polls trigger Critical Event.
- [NotSet] - meaning neither the Warning or Critical Thresholds are set.
...and, if the above abbreviation was something you could drop into an available variable, you could even pass the threshold settings into an Alert for staff to see immediately rather than having to jump through hoops to figure out what Warning or Critical really means for the triggered component.
While I used a SAM example here, the same applies for Threshold Settings in NPM or any other modules as well.
If you like this idea, your vote (KUDO) would be appreciated.


