I have always been impressed at Solarwinds’ capability to monitor a whole host of things out of the box. However, what about when it can’t?
I was recently approached by a member of our servers and storage team who was using a 3rd party monitoring application to track hyper-v stats such as dynamic average memory pressure.
After I had got over the initial shock at the mention of 3rd party monitoring tools (there was much shouting and frothing at the mouth) I knew I had to find a way to track these counters in Solarwinds.
My colleague casually mentioned “But the counters are in windows perfmon!” so after a quick google I came across a powershell command that could restore my sanity and save the day.
Get-Counter
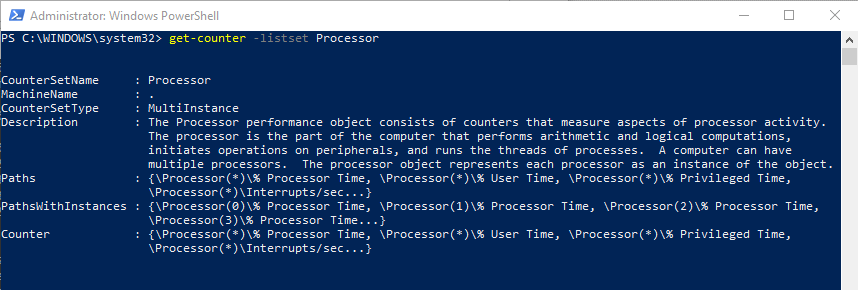
The aforementioned powershell command is get-counter. Running “get-counter –listset *” returns an enormous list of counters for everything under the sun. “Get-counter –listset Processor” shows all the cpu related performance options.
Now I was getting somewhere. I knew that using a few lines of code that I could easily output any numerical value. I also knew that I could use the custom powershell SAM template to capture this data in Solarwinds at regular intervals.
I checked the counter set for Hyper-V using “get-counter –listset hyper-v*” and found the counter I was interested in called '\Hyper-V Dynamic Memory Balancer(*)\Average Pressure'.
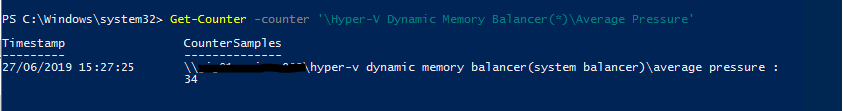
To output a value for this counter the syntax is as follows:-
So the plan now is to use Solarwinds SAM to capture this data and then make it pretty using Perfstack. In order to get this into a Solarwinds friendly format I need to tweak the code a bit.
To the best of my knowledge SAM requires a single value and won’t cope easily with the extra information here such as the column headings and the timestamp. The final output will be:-
Get-Counter -counter '\Hyper-V Dynamic Memory Balancer(*)\Average Pressure'| Select-Object -ExpandProperty CounterSamples | select-object RawValue | measure-object -property RawValue -Average | select -expand Average
The steps to output a single value are as follows:-
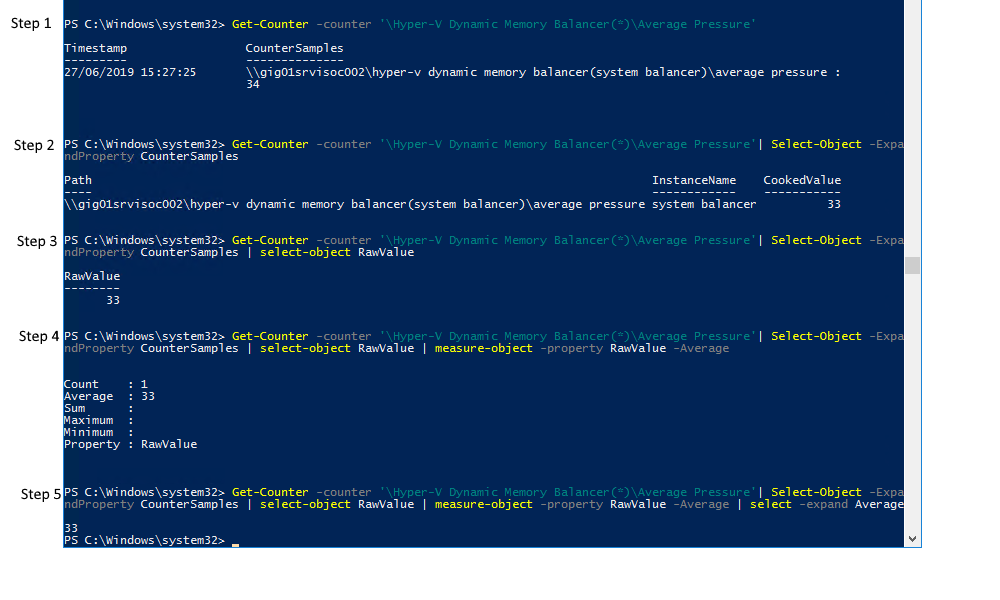
Step 1 – Output the value for average pressure
Step 2 – Expand counter samples and remove the column headings
Step 3 – Select the raw value from counter samples
Step 4 – Select the average of this raw value
Step 5 – Output only the raw value
SAM Magic
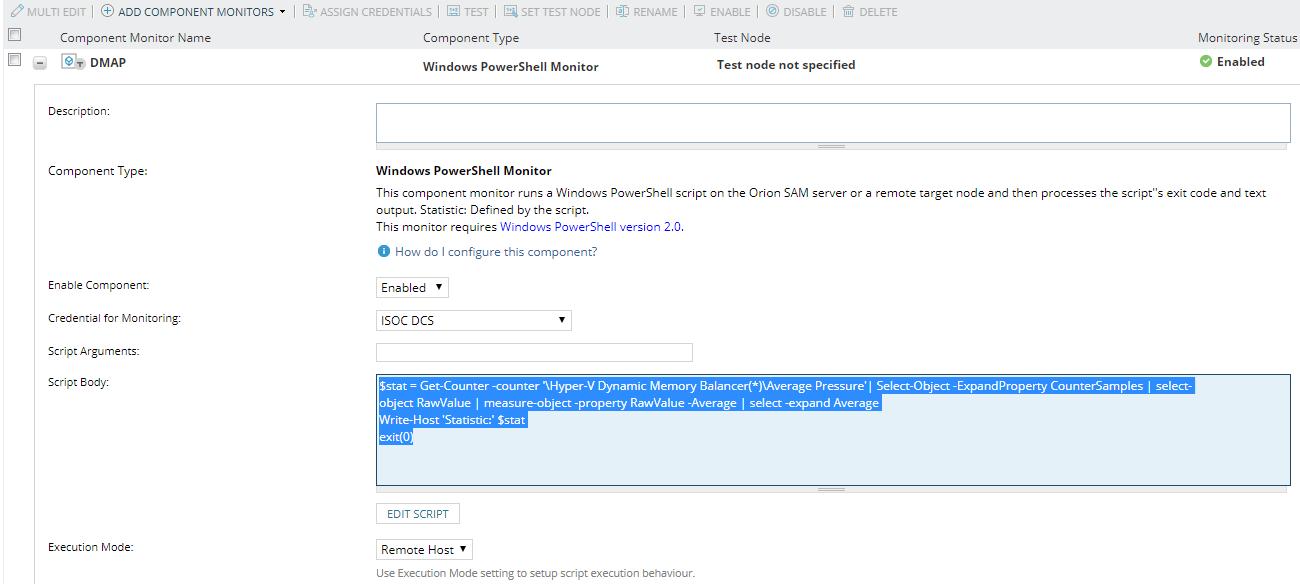
Now I have some working code I can create a new SAM template and add the Windows Powershell Monitor. There are 2 extra lines I need to add in order for SAM to recognise the output value:-
$stat = Get-Counter -counter '\Hyper-V Dynamic Memory Balancer(*)\Average Pressure'| Select-Object -ExpandProperty CounterSamples | select-object RawValue | measure-object -property RawValue -Average | select -expand Average
Write-Host 'Statistic:' $stat
exit(0)
Note that execution mode needs to be set to “Remote Host”
Now I just need to apply the template to the hosts I want to monitor.
Perfstack saves the day
After the initial SAM poll in progress the SAM template returns the average pressure value for each of my hyper-v hosts. I can use Perfstack to add the component resource to track the statistic over time.
Create a new perfstack project, and filter by application and then search for the name of the SAM monitor.
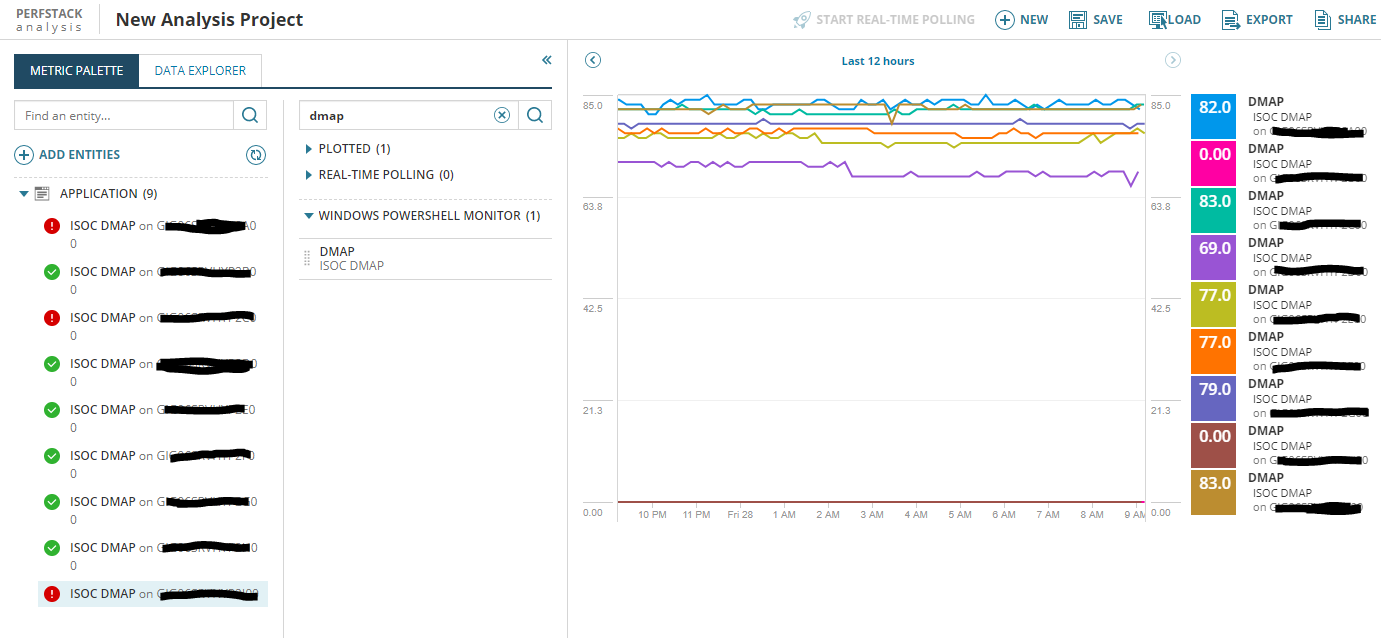
Add the selected counters to the chart and then save the perfstack resource.
The perfstack project can now be added to any view so my server team no longer need the nasty 3rd party monitoring tool!
In summary, the SAM powershell resource and perfstack work amazingly well together and can be used to visually track a whole host of counters.