Let me first grab your attention by showing you what is not working for me and then I will explain the background behind getting to this point.
In an effort to reuse code wherever possible, which is part of an effort to keep monitoring administration the least time-intensive as possible, I always try to create my PowerShell scripts in a way that they can be used for multiple situations. In the above example, I have one PowerShell script that is used in approximately 35 Component Monitors within a single Application Monitor. This Application Monitor is called "Communication Health" and is designed to report the health of Test-NetConnection attempts to IPs associated with the Node. Some examples; the iDRAC IP related to a Dell Server, the Wireless Access Point IPs related to a Wireless Controller, IPs related to a cluster, etc.
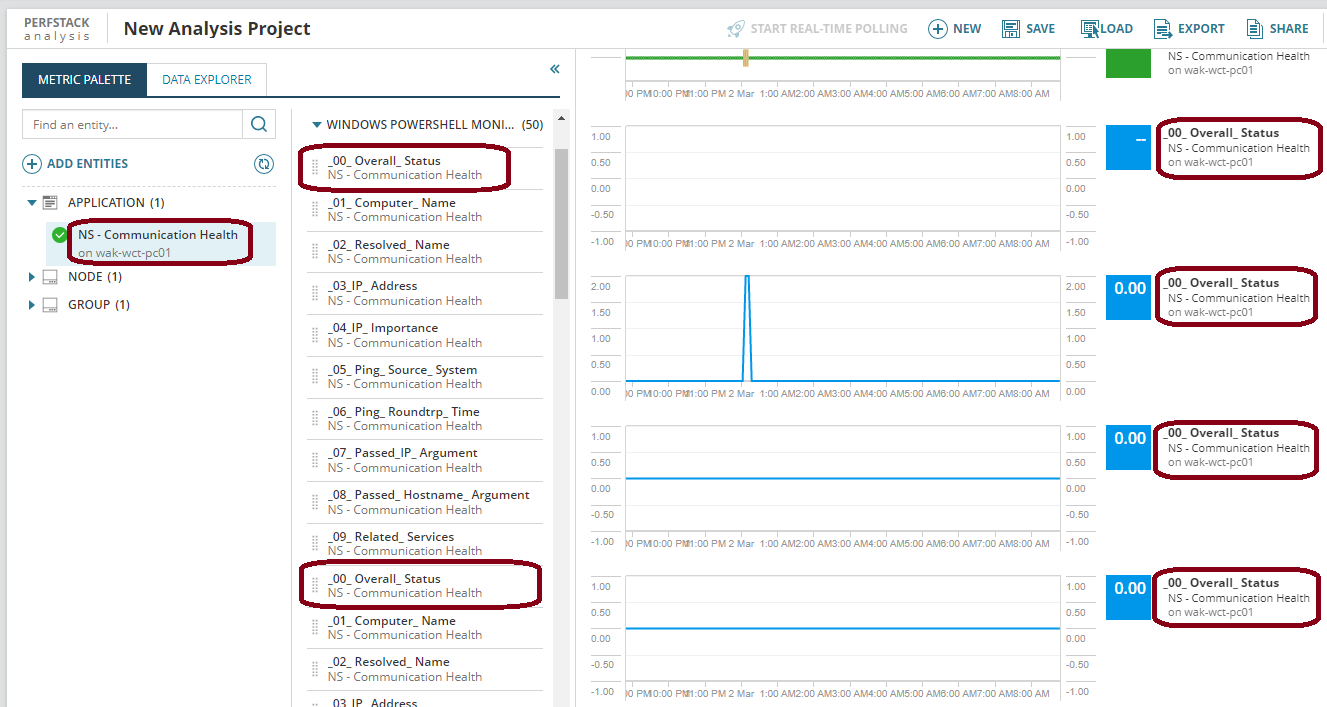
Because the output from the script is always the same for each Component Monitor, the "Script Outputs" are always the same. Example, "_00_Overall_Status" in the above screenshot.
Within the Application Monitor, each Component Monitor is given a unique name a sample of which is provided in the next screenshot below:
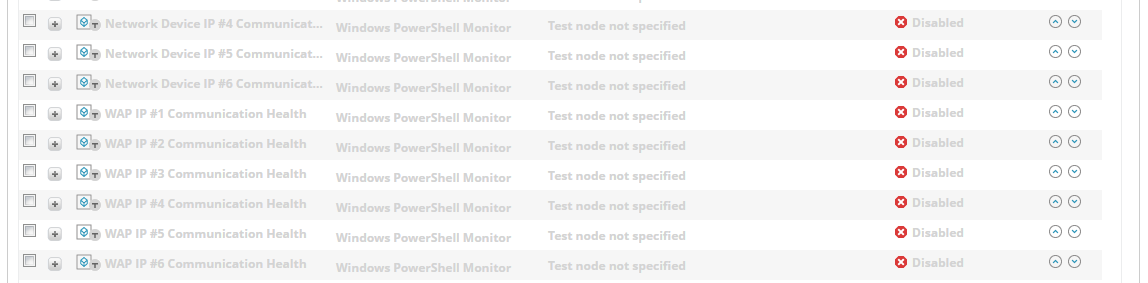
Now I can take this one Application Monitor and assign it to any Node where we want to monitor response of IPs that are not the main polling IP used for the Node itself. Then I just enable the appropriate Component Monitors, which in the first screenshot is a Wireless Access point. The Wireless Controller's IP is the one used to manage the Wireless Cluster and the Application Monitor assigned to the Wireless Controller's Node keeps tabs on all of the WAP IPs for that environment.
Because the Application Monitor Name is the same for all WAP IP monitors and the Script Output name is the same for all WAP IP monitors, in the first screenshot, there is no way to tell which of the 4 "_00_Overall_Status" Script Outputs are related to which WAP. If there was an ability to add Entities to the PerfStack by Component Name, then the charts would be a little more specific. While they still would not name the WAP they are associated with, at least the Component Name would be listed which would be helpful. In the case of these WAP Component Monitors, the title to the right of the chart would change from:
_00_ Overall_ Status
NS - Communication Health
on wak-wct-pc01
_00_ Overall_ Status
NS - Communication Health
on wak-wct-pc01
_00_ Overall_ Status
NS - Communication Health
on wak-wct-pc01
_00_ Overall_ Status
NS - Communication Health
on wak-wct-pc01
to:
_00_ Overall_ Status
WAP IP #1 Communication Health
on wak-wct-pc01
_00_ Overall_ Status
WAP IP #2 Communication Health
on wak-wct-pc01
_00_ Overall_ Status
WAP IP #3 Communication Health
on wak-wct-pc01
_00_ Overall_ Status
WAP IP #4 Communication Health
on wak-wct-pc01
In conclusion, this Feature Request would have SolarWinds make it possible to select Component Monitors as Entities in order to help with a situation like mine.
THANKS for your time.
Mike