Request additional "CPU & Memory" poller to be available for use with Cisco ASR devices. This is due to being unable to duplicate the native "CPU & Memory" poller to update the specific memory OID. The reason for needing to do so is because we currently have various ASR routers falsely reporting high memory usage, when they are in fact operating within normal parameters.
Current list of memory OIDs polled by SolarWinds for Cisco can be found here for 1.3.6.1.4.1.9.9.109:
List_of_NPM_NTA_VNQM_MIBs_and_OIDs_used_for_Polling
CPU_and_memory_utilization_Object_IDs_OIDs_NPM_can_poll
This has been brought up with Cisco Support and their explanation is below.
================ ISSUE EXPLAINED ========================================
We have ASRs that show high memory usage at various time, as reported my our monitoring software SolarWinds. When I go check the command "show platform software status control-processor brief" it does have high usage. The devices will come and go from our dashboard.
I have followed this article, but not sure how to troubleshoot memory to determine if this is normal behavior verses an issue.
https://www.cisco.com/c/en/us/support/docs/routers/asr-1000-series-aggregation-services-routers/116777-technote-product-00.html
Is this normal, and if so, do you recommend adjusting the memory monitoring tool in SolarWinds to only flag if it hits 98% (97% is the highest I've seen)?
Command outputs below for the one device on the list.
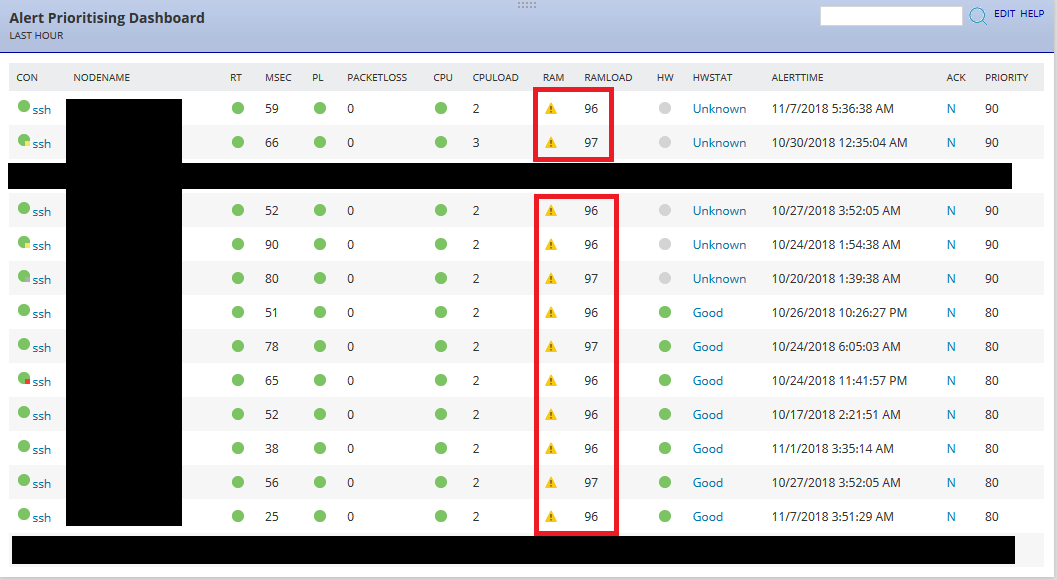
See attached screenshot of what we see in SolarWinds.
=================================================
#show platform software status control-processor brief
Load Average
 Slot  Status  1-Min  5-Min 15-Min
  RP0 Healthy   0.10   0.07   0.01
Memory (kB)
Slot  Status    Total     Used (Pct)     Free (Pct) Committed (Pct)
  RP0 Healthy  3969316  3849744 (97%)   119572 ( 3%)  2582596 (65%)
CPU Utilization
Slot CPU User System Nice Idle IRQ SIRQ IOwait
RP0 0 2.90 7.20 0.00 89.90 0.00 0.00 0.00
1 0.10 0.10 0.00 99.79 0.00 0.00 0.00
2 0.00 0.00 0.00 100.00 0.00 0.00 0.00
3 0.00 0.10 0.00 99.90 0.00 0.00 0.00
#monitor platform software process r0
top - 15:08:57 up 17 days, 22:13, 0 users, load average: 0.04, 0.05, 0.00
Tasks: 305 total, 1 running, 304 sleeping, 0 stopped, 0 zombie
Cpu(s): 2.0%us, 1.6%sy, 0.0%ni, 96.4%id, 0.0%wa, 0.0%hi, 0.0%si, 0.0%st
Mem: 3969316k total, 3854584k used, 114732k free, 271512k buffers
Swap: 0k total, 0k used, 0k free, 2082440k cached
PID USER PR NI VIRT RES SHR S %CPU %MEM TIME+ COMMAND
23765 root 20 0 2804m 835m 351m S 2 21.5 190:56.19 linux_iosd-imag
27281 root 20 0 141m 133m 6252 S 6 3.4 9:07.16 smand
31311 root 20 0 1826m 121m 64m S 5 3.1 1268:45 fman_fp_image
30749 root 20 0 1361m 104m 41m S 0 2.7 16:53.77 cpp_cp_svr
================ RESPONSE FROM CISCO ========================================
Based on the screenshot and the commands attached, you are hitting a cosmetic issue described by CSCuc40262.
On examination of the router, we found that this “high” memory utilization is reflected in the output of 'show platform software status control-processor brief', which displays memory utilization from a system (Linux kernel) perspective:
#show platform software status control-processor brief
Load Average
Slot Status 1-Min 5-Min 15-Min
RP0 Healthy 0.10 0.07 0.01
Memory (kB)
Slot Status Total Used (Pct) Free (Pct) Committed (Pct)
RP0 Healthy 3969316 3849744 (97%) 119572 ( 3%) 2582596 (65%)
In this output, the "Committed" output is what we recommend focusing on, as this represents what memory processes have actually requested from the kernel. The "Used" value, on the other hand, appears high because this includes the Linux kernel cache: this "extra" memory is used by the kernel to store bits of frequently used data, but that memory can be freed at any time if needed. From the perspective of committed memory, this router is not low on memory and appears to be operating normally.
We frequently see cases inquiring about the misleadingly high value in the "Used" column. As a result, this is being adjusted in later code to provide a better representation of what memory is actually available for use. Additionally, two bugs have been filled to document the behavior, these are CSCuc40262 and CSCuv32343:
CSCuc40262 Linux kernel cache is leading to confusion over memory usage
https://tools.cisco.com/bugsearch/bug/CSCuc40262
CSCuv32343 show plat soft status contro [brief]: used memory's definitive accuracy
https://tools.cisco.com/bugsearch/bug/CSCuv32343
The first CCO release of IOS-XE with the full set of changes is the 3.17S release. This issue is mostly cosmetic and I would not personally consider this to be a pressing reason for an upgrade, you might want to apply the described workaround on the bug page instead.
If this issue is causing an alarm in network management software, the following OID should be used instead:
"cpmCPUMemoryCommitted" (1.3.6.1.4.1.9.9.109.1.1.1.1.27)
http://tools.cisco.com/Support/SNMP/do/BrowseOID.do?local=en&translate=Translate&objectInput=1.3.6.1.4.1.9.9.109.1.1.1.1.27
================ END OF RESPONSE FROM CISCO ========================================