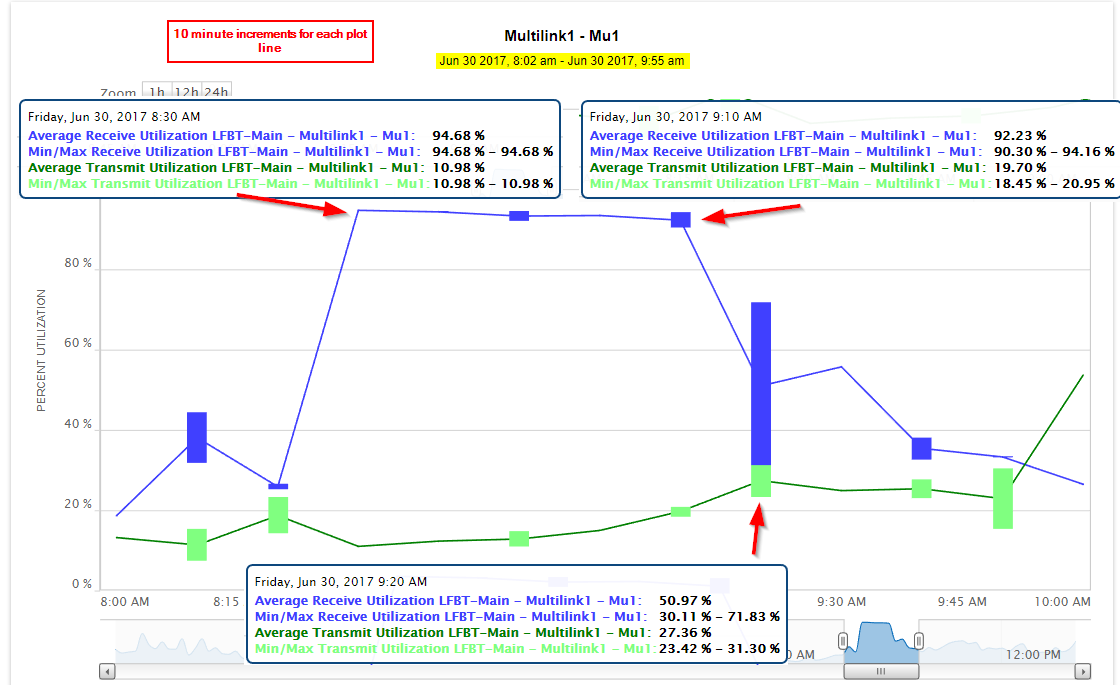
I just realized something I'm doing myself that is incredibly useful but I'd like to see done with solarwinds. Here's the image example I ended up mocking up myself using Greenshot:
Effectively I had to take individual screenshots to compose over the main one to show the tooltips at three different time periods.
So what I'd like is a way to select which timestamps the data is displayed on - it helps a ton for the context of the data being displayed (in this case the min/max/average chart). Maybe you click "select tooltips" and then the chart pauses but lets you click on each plot point you want them to display for? It makes the chart much, much more self-explanatory.
From a UX/UI standpoint, maybe this could "lock" the timestamp for each interval by clicking on each timestamp, with a toggle to start the process? Say I click on "Multi timestamp mode" and then click on 6/30/9:10AM and that shows up even if I look at another timestamp?