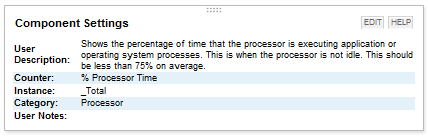
I often times get asked by junior NOC Staff what different charts and statistics mean. aLTeReGo's SAM does a great job of documenting what statistics mean under the Component Settings resource(see below).
I would like:
1) NPM to adopt a similar approach to out of the box statistics collected by NPM(ie- Interface errors, discards, buffer misses, etc).
2) I would also this resource be made available to customers so they can create it and customize it for UNDP and other custom monitoring information.
thanks