I'll tag stevenwhunt on this one 
My team is getting a lot of requests from our application and development teams to be able to see all running services/processes, as well as their compute consumption per process, over time, as well as close to “real-time” as possible for observing full server information for troubleshooting and trend reasons.
Here is an example problem we get all the time: The monitored application "A" is running very slow and is not responding. Why? Because a non-monitored application "B" on that same server is eating up all of the CPU resources.
The only way to know about the issue with application/service "B" is if we were already monitoring it in SAM.
And yes, I am aware of the "Ultimate CPU Alert" from Leon Adato. However that alert and solution will not work if the issue has nothing to do with CPU. What if the process was eating up RAM? or Disk I/O? Or Network? Or, what if the issue is a combination of things on the server?
In addition, my monitoring team just doesn't know exactly what applications or services to monitor unless explicitly told what they should be.
Why not just capture all running process/service data from the server and store it anyways? Then we can truly see the 'whole' picture of the server.
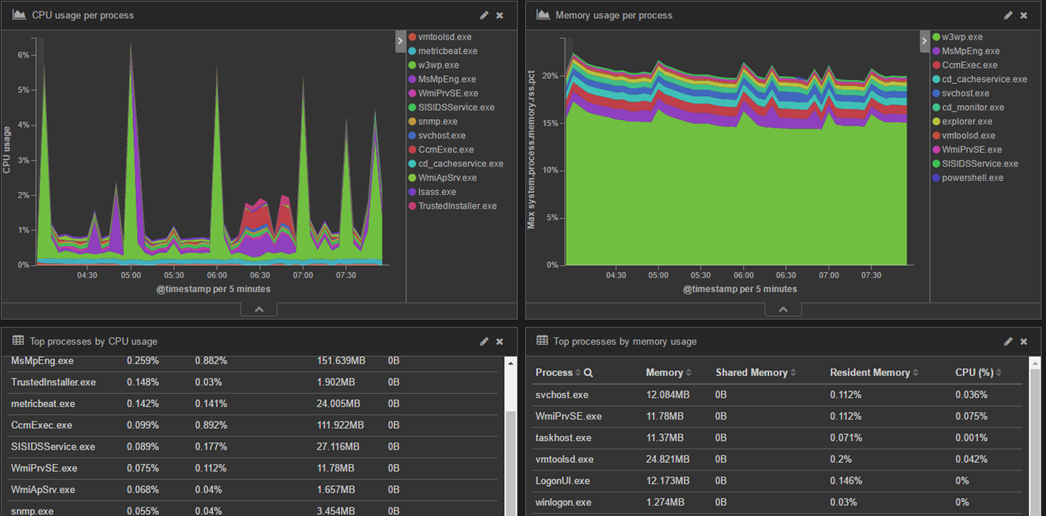
In order to get this level of information for our app and dev teams we’ve had to venture out and use Metricbeat and the Elastic Stack (www.elastic.co) to help serve that purpose.
Take a look at the process and infrastructure information that Metricbeat can capture for the Elastic Stack….
** I am aware that the Elastic Stack is a completely different tool with a completely different design and purpose. However it is increasingly providing levels of infrastructure information that we've relied on SolarWinds to provide for years -- not that Elasticsearch is a better product than SAM, it is just different than SAM and is designed for a variety of use cases.
But my point is this --- It is THIS information that my application teams are looking for. This is the data they care about. Sure, it is great to know if a known process, service, or application is not running (i.e. availability “is it up or down”) or causing a problem because that is VERY important. And SAM does a fantastic job at alerting on availability. But what about the unknowns? But we need better, more detailed, information about full system resource usage/performance even if the process is not monitored by default.
This is a capability that is NOT a part of core SAM functionality at all (at this time) but is VERY valuable especially for test teams that need to run performance tests, or go back to see if a different service/process caused an impact to system or application performance.
Something like this in SAM would be a great addition.
... or maybe SAM is not the correct product for this? I have no idea. Just wanted to throw this request out there.
