Hi,
While I love the Multiple Series Chart resource I feel it is missing something that would be used by most if not all customers (assuming they knew it was there ofcourse). The following example is currently difficult or impossible to do effectively.
I often have a need to put some charts on a summary page such as a page which displays the same sort of information as the existing Top 10 page, but as a visual chart. This needs to include all resources of a certain type i.e. Top 5 Interfaces by Percentage Utilisation. Currently you would have to select all interfaces on the left and add them to the right. However when a new device is added and its interfaces added, it would be necessary to add these to the resource.
Also on large installations adding several thousand interfaces in this manner is not efficient and practical.
It would be a good feature to be able to define a Dynamic Query in the same way you can with the Group management. The following image shows an example of populating a Top 5 WAN interfaces on a chart via a query rather than manual selection
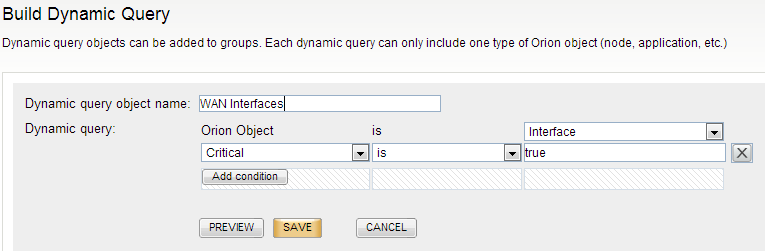
Mark
