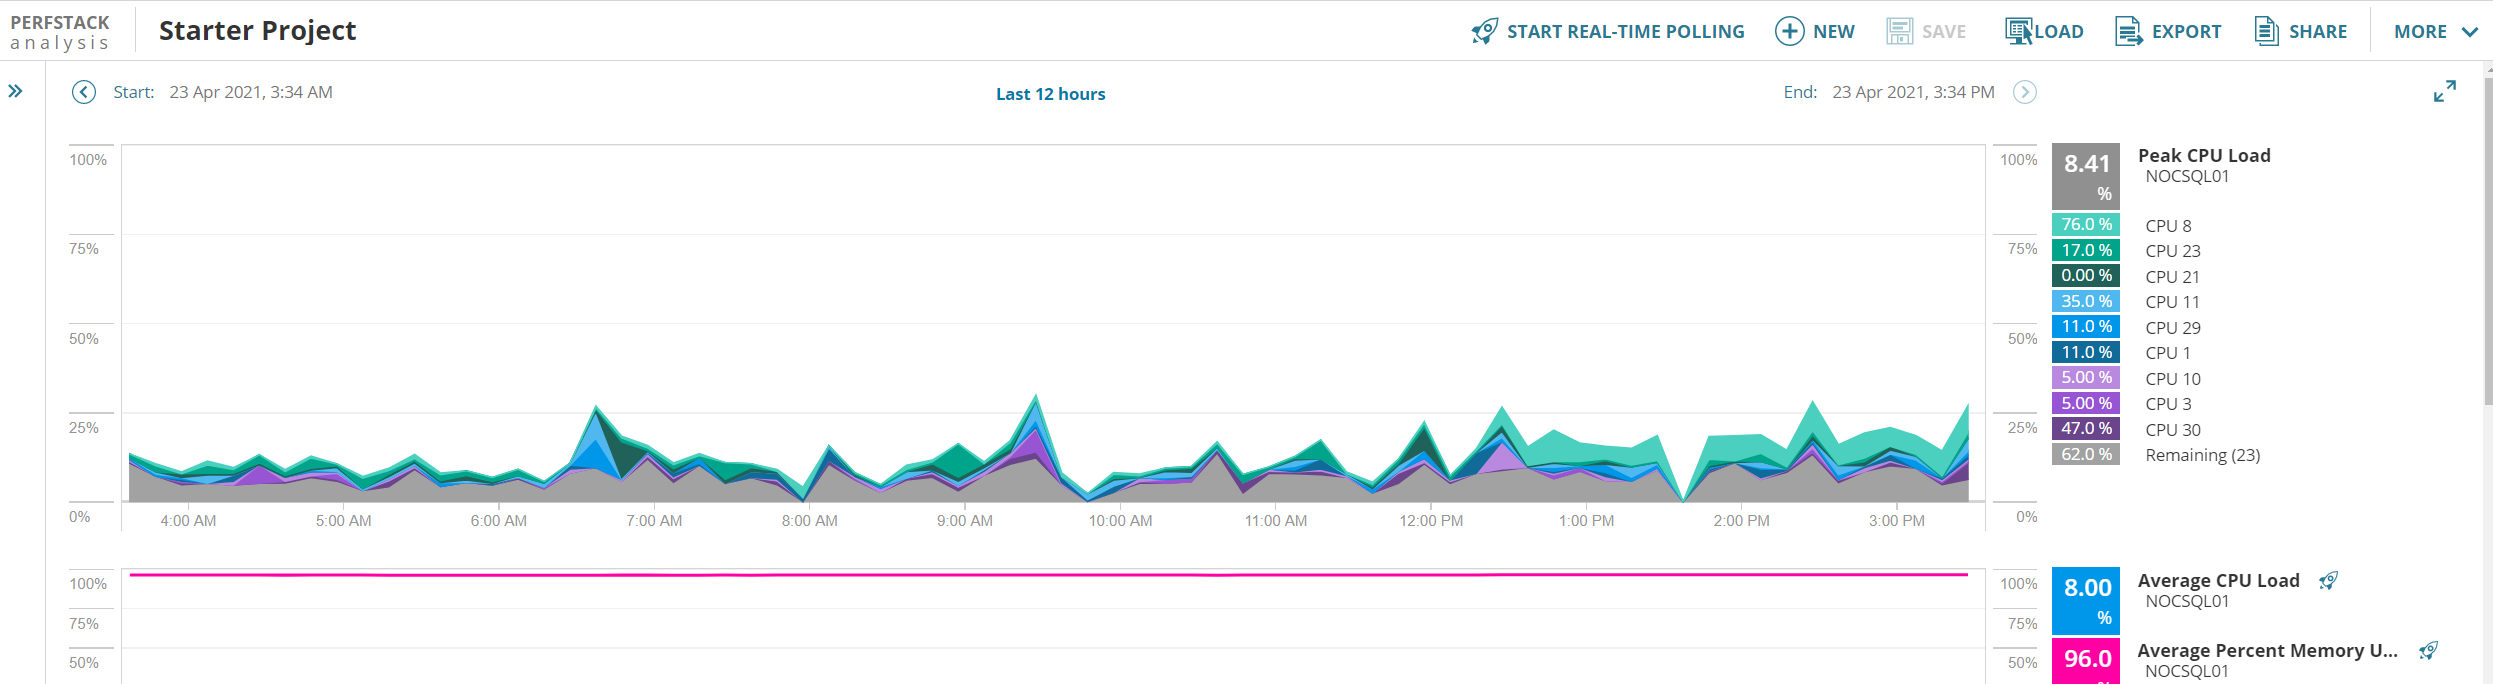
A dynamic Dashboard at the CPU / RAM / Vol level that brings us a Top of consumption for each metric in X period of time (Configurable) and can be filtered by some custom property, this dashboard must not be a table, it must be a list graphics hopefully from PerfStack