I think this request is fairly simple and straightforward, and can already be accomplished, in a limited fashion, with some user created modifications.
Here is a link to my current solution:
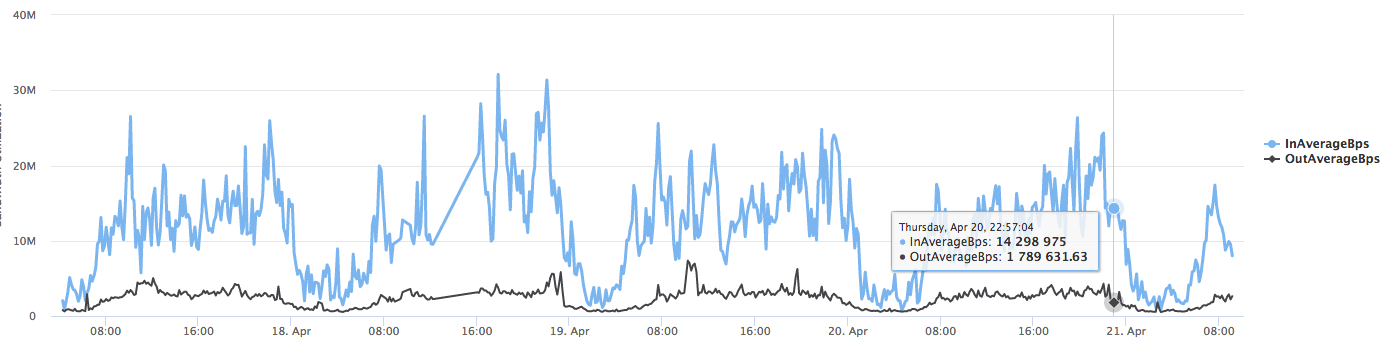
Custom SQL Dynamic Graphing Resource
I would like a native feature/function that would simply create a new, user defined, graphing resource for each interface/object, qualified by a custom property value. (or any user defined value)
We need to see a single graph, for a single interface. We need to do this for numerous interfaces, across thousands of different nodes, which we would group by a custom property, customer name. And all of the graphs, for all of the different interfaces, need to be displayed on the same page.
All of these interfaces are currently using custom properties, to group them by customer, purpose, area, etc...
Any time a new interface is added to NPM, and has the correct values for specific custom properties, it is automatically added to the group it qualifies for. These mechanics already exist in NPM.
I simply want to extend that functionality to automatically create a new graph, on an existing page, for each newly added interface.
Currently, we have to manually view the page(s) where we need to add new graphing resources. Edit the page. Copy the existing graphing resource(s). Save the page. Edit the newly copied graphing resource, and modify it to reflect the newly added interface.
All of that, to simply add a copy of the previous graph on the page, for a new interface.
SolarWinds, please give me a way to be more efficient.
If I have 10 interfaces, each with the same, specific custom property value, I want you to build 10 graphs (all graphs being the same type, with the same options set), 1 per interface.
If somebody adds a new interface (giving us 11 interfaces in this example) with the same cp value(s), I want you to build another graph for me, on the same page as the others with matching cp values.
Now, we have 11 interfaces, from 11 different nodes, each with matching cp values.
I built the first graph, but, since SolarWinds is such a great tool, it went ahead and automatically built new graphs for all of the other 10 interfaces...
Okay, I suppose I have repeated myself enough here...
Thank you,
-Will