Background Issue:
Interface graph statistics very slow to show and mostly timeout this experience include NTA as well.
Troubleshooting:
We have 2 APEs and this timeout issue mostly occurs on objects monitored under APE-2
From MPE always showing this warning from DB maintenance log, this also shows when you run the active diagnostics.
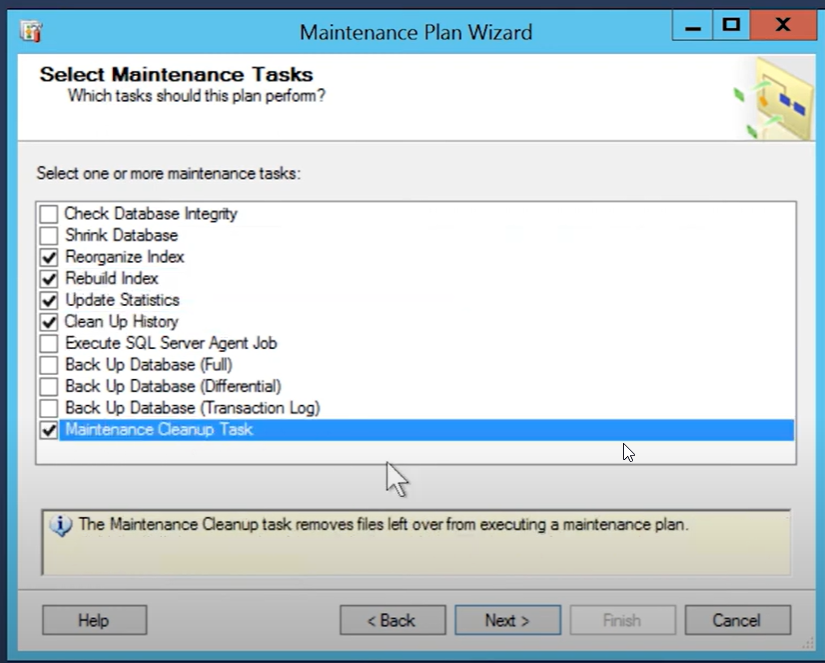
Run DB maintenance on MPE and running DB maintenance plan on SQL server not helping, log is still showing same timeout experience
2025-08-09 02:33:02,132 [1] WARN SolarWinds.Orion.Common.SqlHelper - Long Running Query: ALTER INDEX [PK_APM_HardwareItem_Hourly] ON [APM_HardwareItem_Hourly] REORGANIZE Execution time 77 seconds
I found the issue is mostly under APE-2 I tried to check if the server has DB maintenance program like in MPE, and IT DOES!!!
Checked the log of "swdebugMaintenanceExecutionHistory.log" it never runs so this confirms there is no task scheduler or trigger running this program.
Tried to run it, I saw log index defragmentation and bla bla.. (I also run on APE-1 as well)
Directory: C:\ProgramData\SolarWinds\Logs\Orion\swdebugMaintenanceExecutionHistory.log
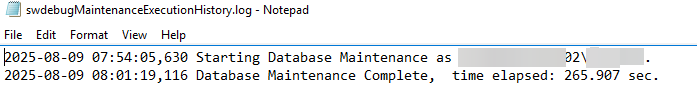
After waiting both finished and test again the interface graph and NTA.
NOW IT"S WORKING FAST !!
Issues:
- I don't know why DB maintenance plan on SQL server it's not affecting even though it has reorganize index and rebuild index. Is there any schedule recommendation to run this maintenance plan? daily or weekly?
- How to create schedule Database maintenance program on APE? I'm looking to schedule the same time with MPE which is daily on 2:15AM