Hi THWACK Community! 
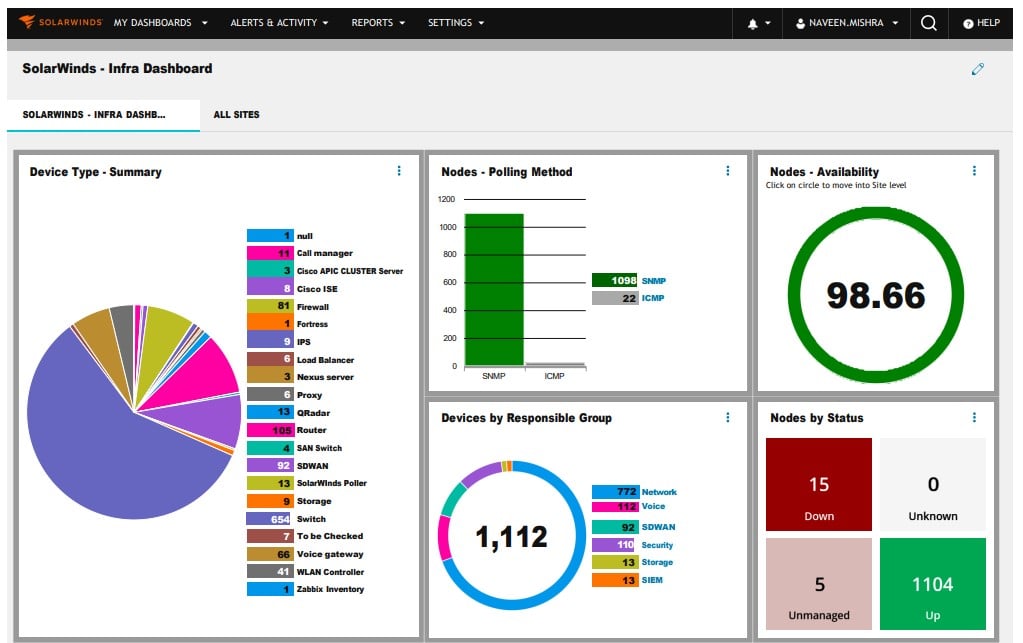
I’m excited to share a modern, fully drill-down Infrastructure Dashboard I recently built using SolarWinds. It’s designed to make day-to-day monitoring more intuitive, visual, and actionable.
Key Highlights of the Dashboard:
Fully Drill-Down Capable: Click on any KPI, widget, or chart to deep-dive into device/site-level insights.
Covers Multi-Domain Monitoring: Network, Voice, Storage, Security, SD-WAN, and more – all in one place.
Real-Time Visibility: Live stats on availability, config backup status, polling methods, and interface utilization.
User-Friendly Layout: Designed for quick decision-making and minimal navigation.
 ️ I’ve attached a preview ) of the dashboard layout and will soon share the code, SWQL logic, and steps involved in building it — so anyone can replicate or enhance it for their own environment.
 What it helped with:
Faster RCA during outages
Reduced dashboard hopping
Empowered non-admins to self-serve basic checks
 Would love to hear:
Let’s collaborate and inspire better NOC visibility across the board.
Thanks!
– Naveen Mishra