HI,
I am looking to create a report to check the concurrent user on the SolarWinds console, how many users are login to the console at a time.?
Thank you in advanced!
gaba8696,
Assuming you have SAM & assuming you've enabled, tweaked and assigned SolarWinds Server monitors to your web server(s) then this SWQL query will get you to where you want to be. Just replace the nodeids with your systems nodeids.
Sorry, I forgot to add some context. I have 3 SW Additional Web Servers which is AWS1, 2 & 3 in the query. My 3 web servers are shown in the KPI widget and the PerfStack widget. The nodeID's in my query are for my 3 web server. You'll need to swap these out with your SW web servers nodeid's of if you have more than 3 web serves then add the nodeid's for them.
Again, sorry about that.
Hi @bourlis - Thank you for the response. I have configured successfully, just wanted to check these 3 tabs are representing what?
No problem, I have configured the same based on my environment. I have only one web server which is main polling engine server.
Thank you for your help.
Additionally, I want to check about the Current connection value. I was login to the server but still the current connection value was showing as 0. How is this value calculating?
hello. can you please share this dashboard, and let us also know how to add multiple tabs in on dashboards as seen in the snapshot you shared. thank you @gaba8696
Sorry gaba8696 &amer10286 when I first supplied the query I made some assumptions and didn't follow up. So I I may let me add some foundation, also I've improved this dashboard, so what I shared in the past is out-of-date in our environment.
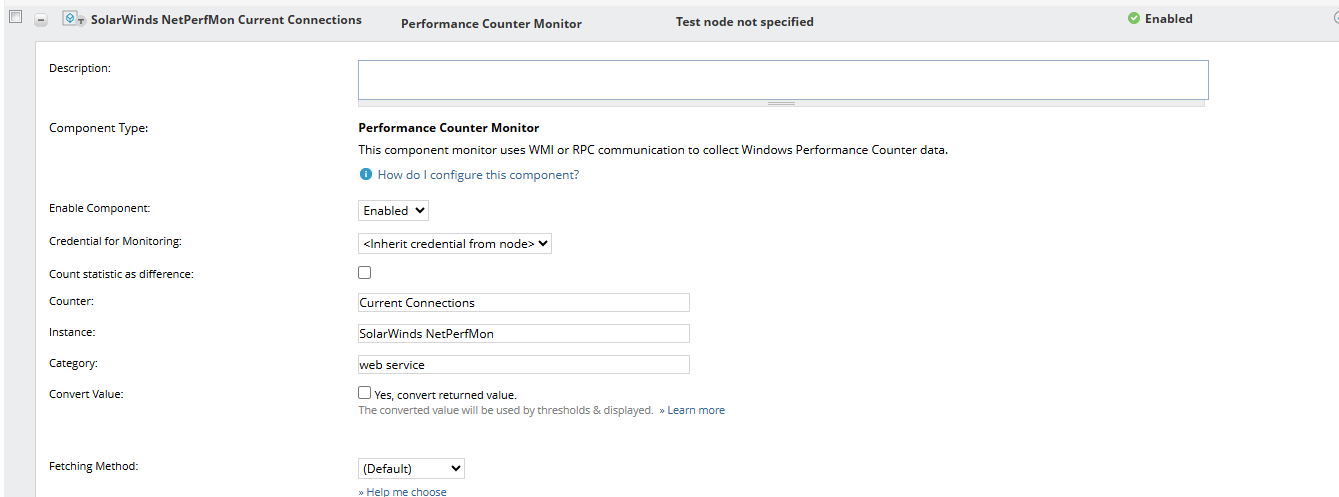
Foundation - I built the following SAM Performance Counter Monitor:
Here's what that the template looks like:
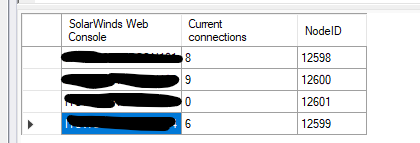
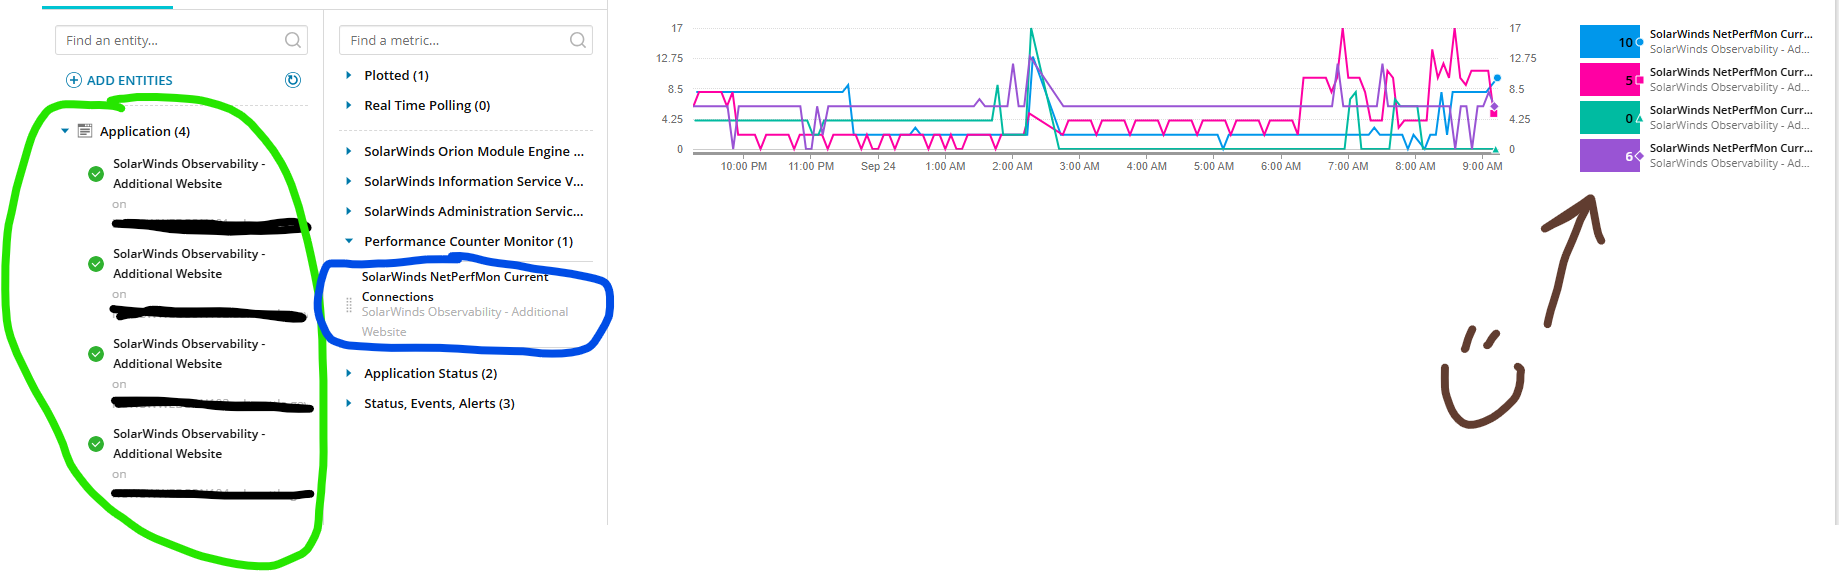
Once that starts collecting data you have the foundation to build your dashboard view. If you have multiple web consoles get all of ducks in a row with this simple SWQL query:
SELECTc.Component.Application.Node.SysName as [SolarWinds Web Console],c.ComponentStatisticData as [Current connections], c.NodeIDFROM Orion.APM.CurrentStatistics cwhere (c.ComponentName = 'SolarWinds NetPerfMon Current Connections')
Your return will look something like this:
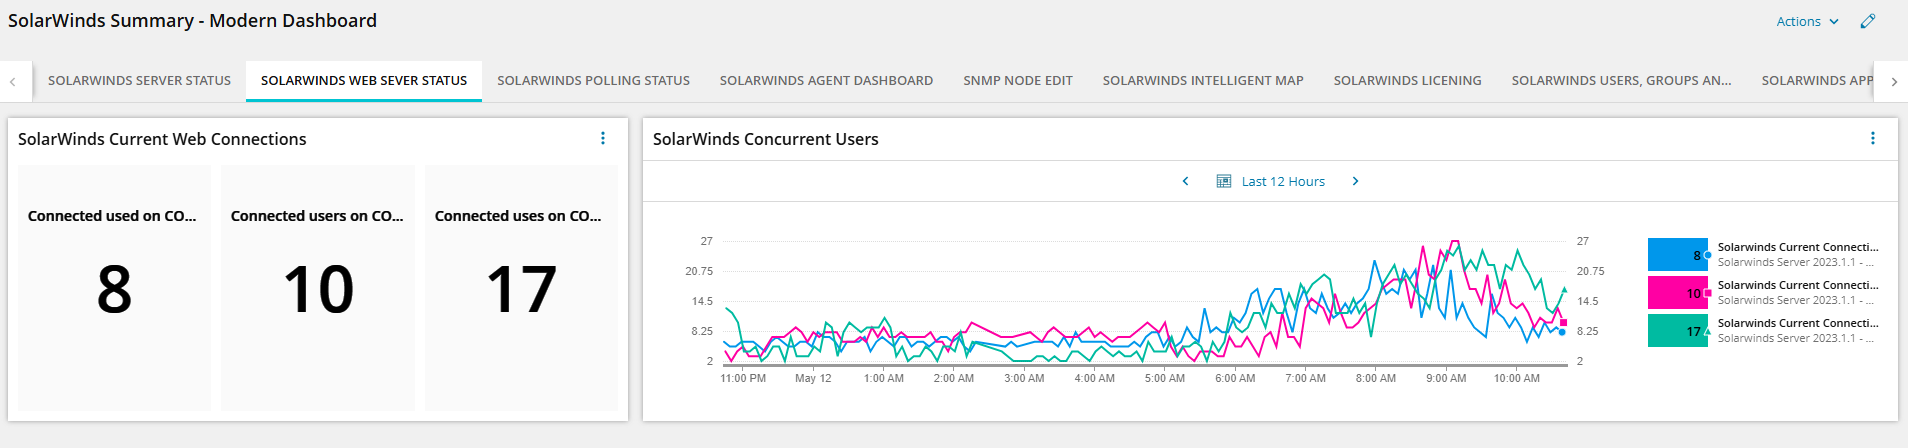
Now you can take this info and build your KPI's for each of your web consoles. Here's what it should look like:
SELECTc.ComponentStatisticData as [Current connections]FROM Orion.APM.CurrentStatistics cwhere (c.ComponentName = 'SolarWinds NetPerfMon Current Connections') and (c.NodeID = '12598')
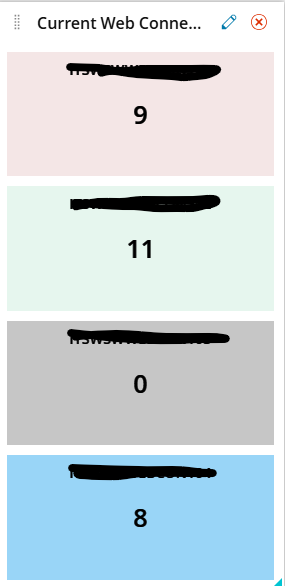
Just repeat this for each of your web console by swapping out the NodeID. When your done your KPI will look something like this, I added color and threshold to my KPI's.
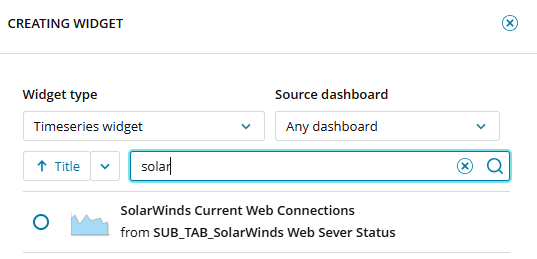
Next simply use the new Component NetPerf counter for your PerfStack, save it and then add it to your dashboard as a Timeseries Widget
And there you go, you have a KPI and a PerfStack timeseries widget.
It depends on your SolarWinds version, which version you are using. If you are using 2024.4.1 or latest version so you can add multiple tabs in a single dashboard.
@bourlis This looks great, Hope it will give the exact number of logged in user. I am definitely goanna try this in my environment. Much appreciated your help.
Now, like I said I've made some improvements and I use this new improvement to show customers what SolarWinds Modern Dashboards can do. I've gotten an overwhelming positive response on this next widget. Most users don't have access to our F5 Load-Balancers and most users find the default SolarWinds Load-Balancer page as a tsunami of info and back away from it.
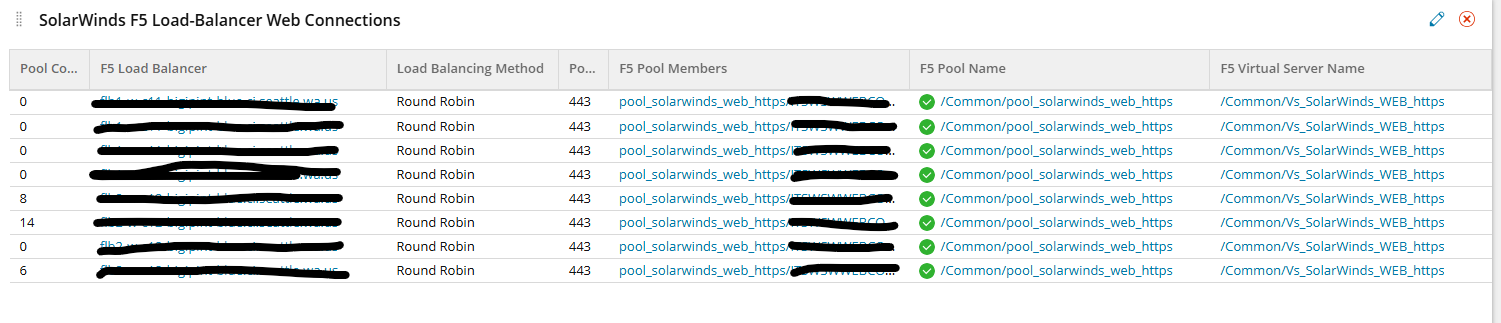
So I added a nice simple to view table of my F5 Pool environment.
I found this to be rather labor intensive but well worth the payout. Here's what the SWQL query looks like for this one.
SELECT f.Caption,f.DetailsUrl as [F5 System Link],f.VirtualServers.Port,f.VirtualServers.Name as [F5 Virtual Server Name],f.VirtualServers.Connections as [Total Connections],f.VirtualServers.DetailsUrl as [F5 Virtual Servers Link],f.Pools.Name as [F5 Pool Name],f.Pools.DetailsUrl as [F5 Pool Link],f.Pools.Status as [F5 Pool Status],f.Pools.LBModeDescription,f.VirtualIPAddresses.Name,f.VirtualIPAddresses.IPAddressID,f.Pools.PoolMembers.ShortName,f.Pools.PoolMembers.Connections,f.Pools.PoolMembers.DetailsUrl as [F5 PoolMembers Link]FROM Orion.F5.System.Device fwhere f.VirtualServers.VirtualServerID in ('4149','5815') and f.VirtualIPAddresses.IPAddressID in ('1821','2621') and f.Pools.PoolID in ('6068','4439')
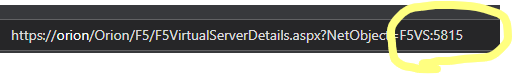
For this query to work you'll need to find the VirtualServerID, IPAddressID & PoolID for your SolarWinds instance. That is the labor intensive part and the best resource to find this information is in the ULR for the virtual server, VIP and the pools. For example the virtualserverID is called out in this URL
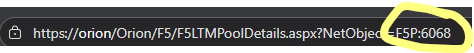
and here's one of the poolID being called out in this URL
The VIP information took some leg work and cross referencing in the DB
I just posted a little how-to write-up on how to add tabs to a modern dashboard. See link below
crash-course-on-how-to-add-tabs-to-a-modern-dashboard
Hopefully that'll help you on your journey to building awesome modern dashboards!!