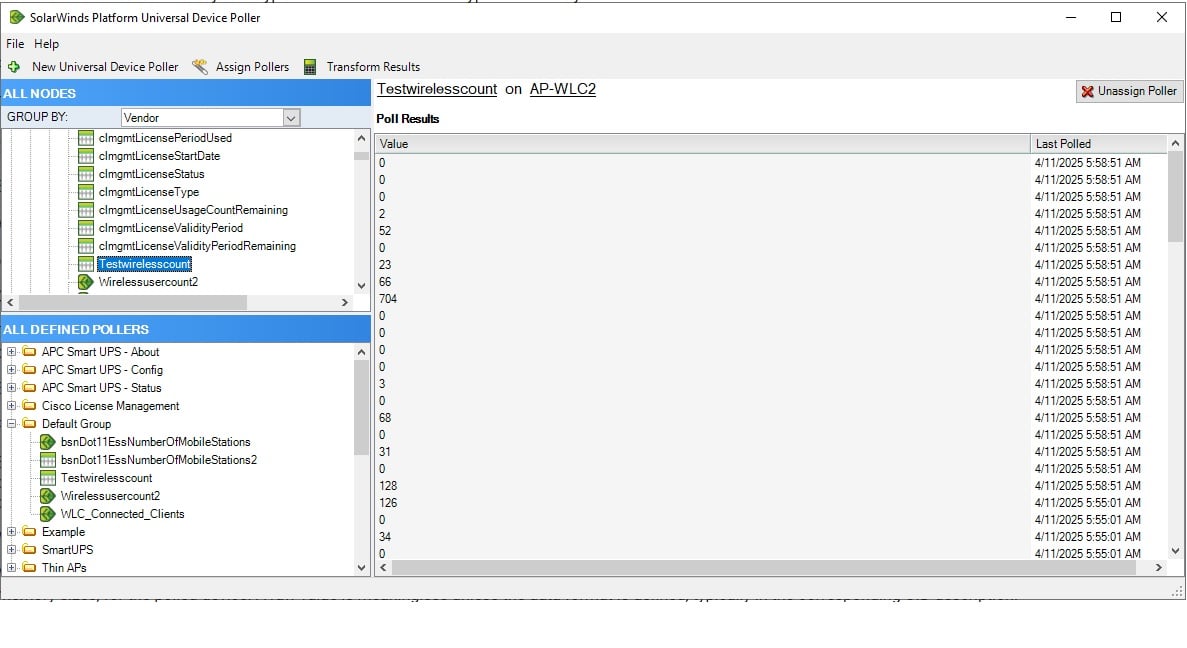
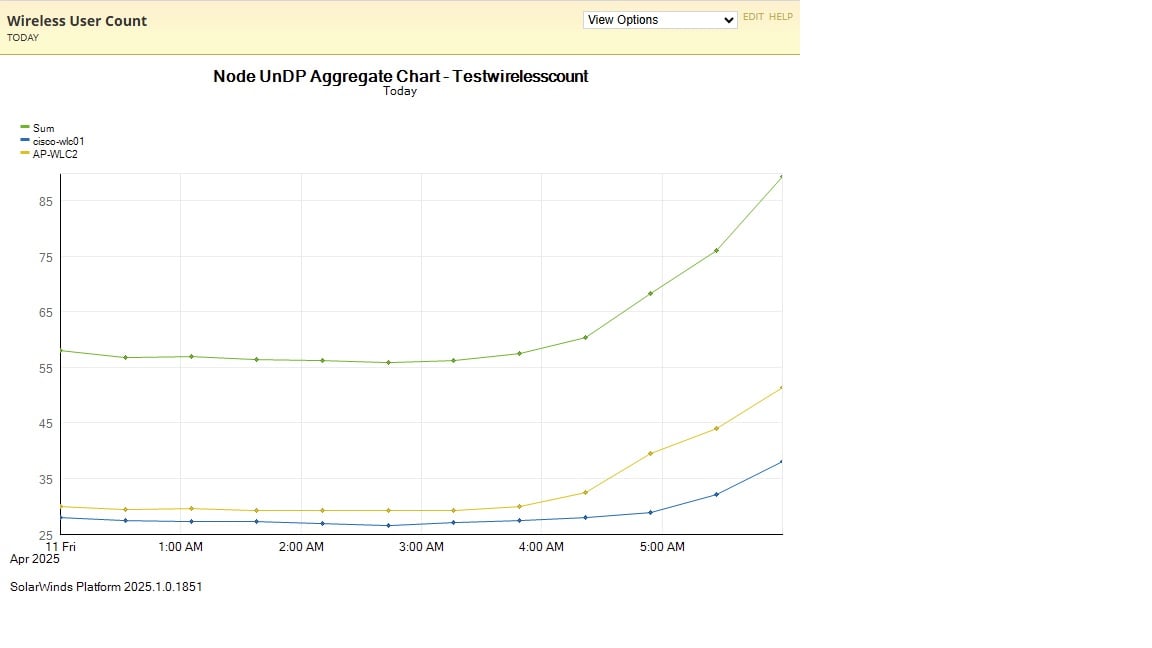
So I have been working on creating a graph that shows the number of wireless users that are connected to the network. I understand that this was fairly easy with the older Cisco 5500 series controllers but Cisco seemed to have dropped what the OID reports in the 9800. This being said I recently learned that using OID 1.3.6.1.4.1.14179.2.1.1.1.38 I am able to get the exact number of users that are connected to each of the different SSIDs that are configured on the controller. I am looking for a way to display this on a graph.
I validated that the information that I am getting back from the Universal controller that I created aligns with the number of users for each of the SSIDs configured.

The problem is the chart that I have created is only looking at a single value and is therefore only showing the number of clients connected to a single SSID on both of my controllers.

Given the results of the poller, What is the best way to create a graph that shows the connected users to each of the SSID along with a total summary line?