I'd like to understand how a SQL query would work to do a graph that would show top 5 percent interface utilization. I've figured out how to do this with the GUI but I can't quite wrap my head around how this would be done in SQL? I've done similar queries where its a singular number being summed or calculated then sorted but I'm not sure how you'd do the same thing with plotted data on a graph.
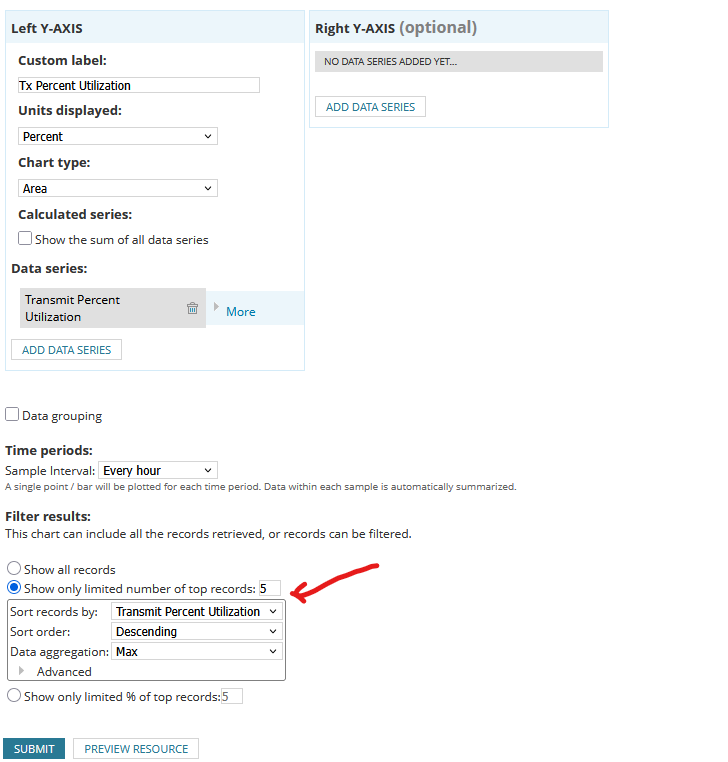
Here's how I have it working in the GUI but I'd like to do a query as this isn't exactly the data I need. I think the bottom section top 5 records with the sorting is the bit I'd like to understand how its doing the query on the back end.