I have imported the Citrix XenApp Session Statistics template from Citrix XenApp Session Statistics .
I have assigned about 30 Citrix Nodes to the Application - Citrix XenApp Session Statistics, and after a poll, I can drill down to a XenApp node and see the latency information. So, communication, configuration, and permissions are good.
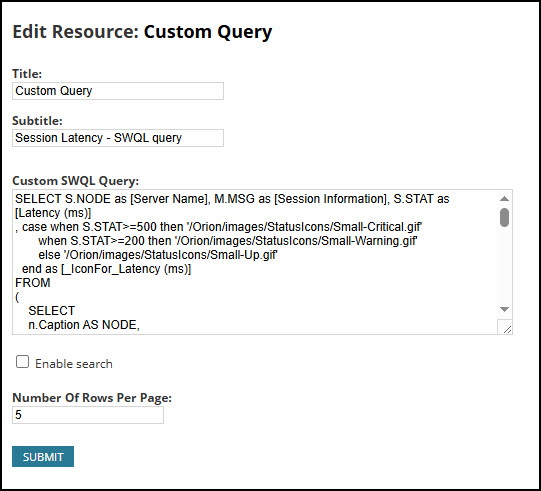
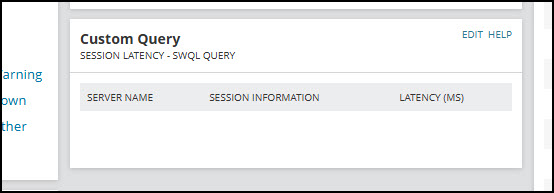
However, I have attempted to add the Custom Query widget to the summary page, nothing displays. I am sure there is something simple I am missing. Or maybe there is an error in the query on the twack article.
Can anyone assist or give me a clue?
Thank you!