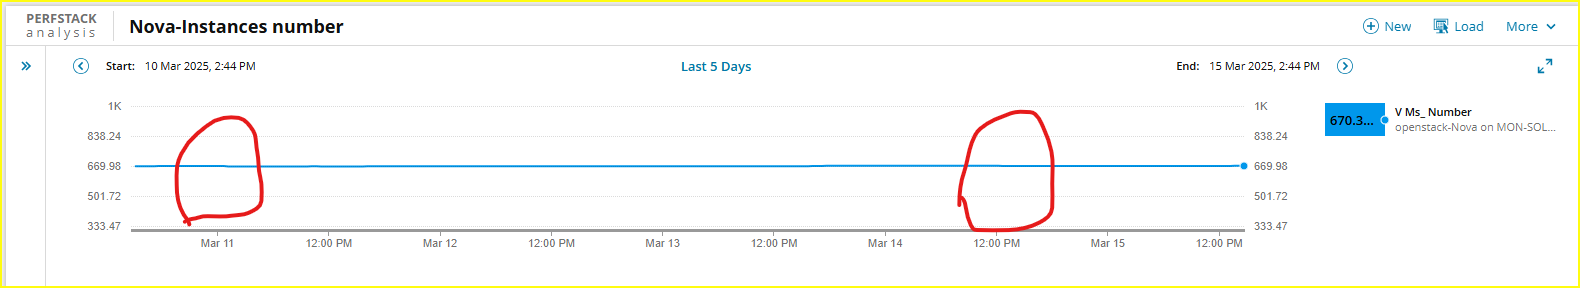
Hi every one, I created a PerfStack dashboard to show how many VMs exist in my environment. The problem is that the changes are small, and the chart scale is too large, it difficult to detect changes on the chart.
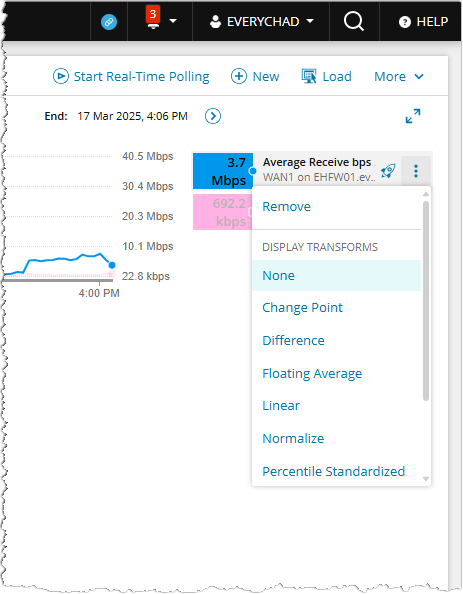
How can I the chart scale As you can see in the two shown, I have removed or added VMs, but the chart line does not change enough to detect these changes.
this is an example that 2 vm are deleted on vmware but change is not visible on chart