Hi Folks,
I'm trying to create a KPI widget on a modern dash board that changes colour (Green = UP, Amber or Red = Down ) when any nodes (Windows Servers) in a group has a monitored service is in a stopped state.
the SWQL Code count the number of Node in a container (Group) by the the ContainerID and checks the status of any monitored services for that node in the group. The code sets the min Application status level returned (if you are monitoring more than 1 server and 1 service).
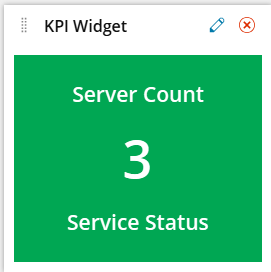
the values returned are the Total Node Count as "Nodes" and the worst Status Value. normally 0 for Good, 2 = Down and if it happens 3 = Warning.
The Server count is the number of Nodes, the Status is the Colour based upon UP/Down/Warning. I can never get the Colour to change, as I'm not monitoring a threshold. :-(
Select Count(1) As Nodes,
Max(ChartData.AppStatus) As Status
From (
SELECT Count(1) As [GroupCount],
[Nodes].Caption,
CASE WHEN min([Nodes].Applications.Status) = 2 THEN 2 -- Set Critical value to 2
WHEN min([Nodes].Applications.Status) = 3 THEN 3 -- Set Warning value to 3
Else 0 END As AppStatus
FROM Orion.Nodes AS [Nodes]
RIGHT JOIN (
SELECT DISTINCT
[OC].MemberPrimaryID,
[OC].Name
FROM Orion.ContainerMembers AS [OC]
JOIN Orion.Nodes [Node] ON [Node].NodeID = [OC].MemberPrimaryID
WHERE [OC].ContainerID = '100'
) GNodes ON [Nodes].NodeID = GNodes.MemberPrimaryID
Where [Nodes].Applications.ApplicationID IN ('1500','2500','3500')
Group BY [Nodes].Caption
ORDER By [Nodes].Caption
) As ChartData