Hello,
I have a monitor I am using for node availability. I found portions of it online and adjusted it to my needs. What I would like to do in a Modern View is request the availability for 30, 60, and 90 days, and have it seen in one table. Below is the code I am using.
SELECT N.Caption AS [NodeName]
        , N.Status
        , N.DetailsUrl
        ,  round(AVG(N.ResponseTimeHistory.Availability), 2) AS [Avail_30]
FROM Orion.Nodes as N
WHERE N.ResponseTimeHistory.DateTime>ADDDAY(-30,GETUTCDATE())
    AND N.CustomProperties.Model = 'Firewall'
GROUP BY N.Caption, N.Status, N.DetailsUrl
ORDER BY AVG(N.ResponseTimeHistory.Availability)
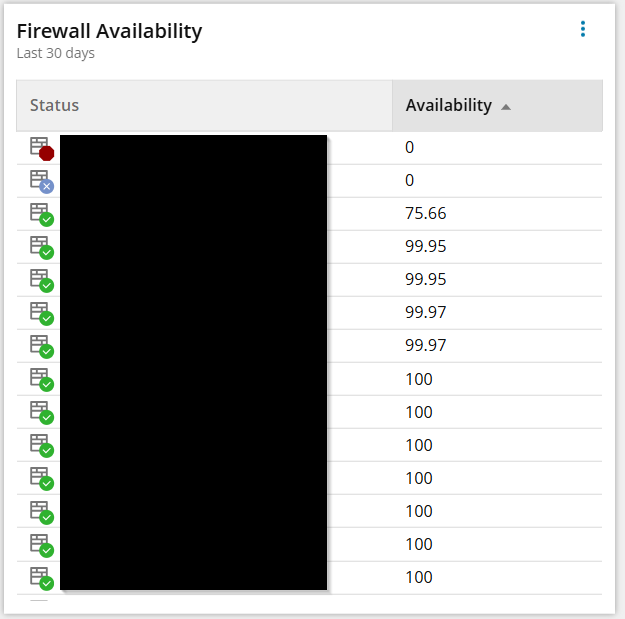
The current view looks like the box below. It is currently giving me what I need for the average over a single time, but I'd like to see two other time slices in the same box. I'd like to see the other averages under their own headers next to the 30 day. Is there a clean way to do this?
Any help would be appreciated.