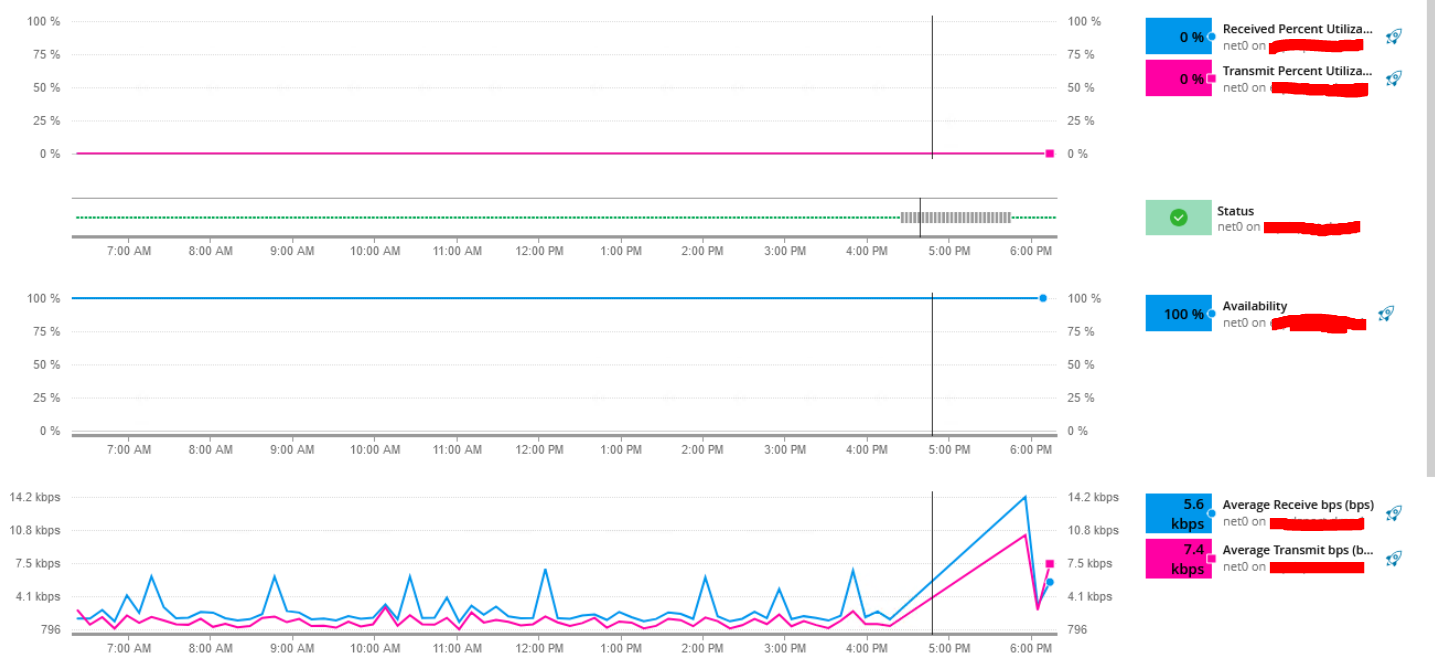
Hello, I need a modern dashboard widget that shows if a certain critical interface is down for any reason. I was originally trying to poll the interface's Availability metric, but then I learned that if the entire node is powered off, Solarwinds doesn't count that against it's Availability % (see attached). I think we could use the Status field (green line with block of black when it was powered off), showing % with Status = Up. Is it possible to set up a SWQL query that calculates what percentage of the past 24 hours the interface has a status of Up? That would give us more meaningful data, since if the node itself goes down we certainly want that reflected in the statistic.
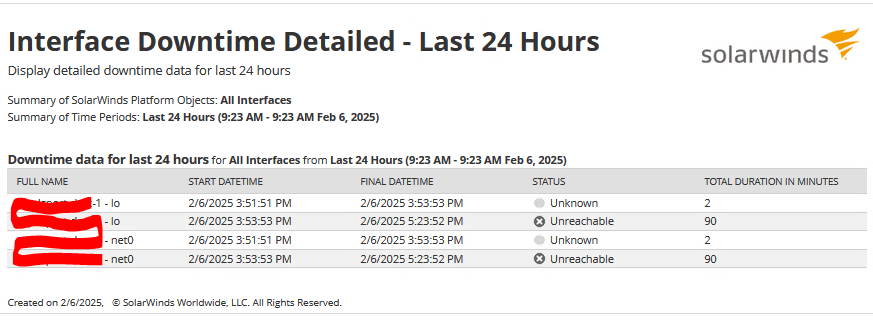
I see there are canned Solarwinds reports named "Interface Downtime Detailed - Last 24 hours" (example below) and "Interface Downtime Summarized - Last 7 Days". Both of those accurately show the downtime of the interface from when the node was powered off, so if someone could direct me towards how to adapt either of those reports onto the modern dashboard that would be very helpful as well. I tried using the graphical query builder and manually adding the columns from the original report into the modern dashboard widget builder, but kept getting errors. Any help greatly appreciated.