Hi all,
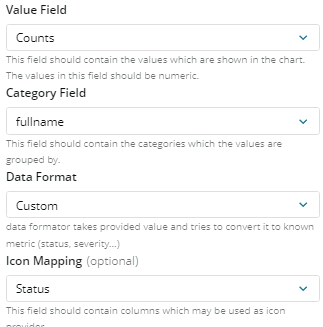
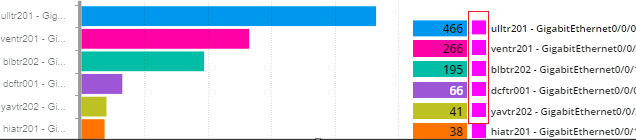
Is it possible to add custom text to these dashboard graphs, as on the below graph was trying to insert %, which is appearing as pink box.
Below is the query used:
SELECT TOP 10
    i.fullname,
    COUNT(i.fullname) AS Counts,
    CASE
        WHEN COUNT(i.fullname) >= 1 THEN '%'
        ELSE ''
    END AS Status,
    ir.DeviceRegion
FROM Orion.NPM.InterfaceTraffic it
INNER JOIN Orion.NPM.InterfacesCustomProperties icp ON icp.interfaceid = it.interfaceid
INNER JOIN Orion.NPM.Interfaces i ON i.interfaceid = it.interfaceid
INNER JOIN Orion.NodesCustomProperties ir ON ir.NodeID = it.NodeID
WHERE icp.iswan LIKE '1'
  AND (it.inpercentutil > 95 OR it.outpercentutil > 95)
  AND (it.ObservationTimestamp > ADDDAY(-90, GETutcDATE()))
GROUP BY i.fullname, ir.DeviceRegion
ORDER BY Counts DESC;
here am trying to use status column to get output,