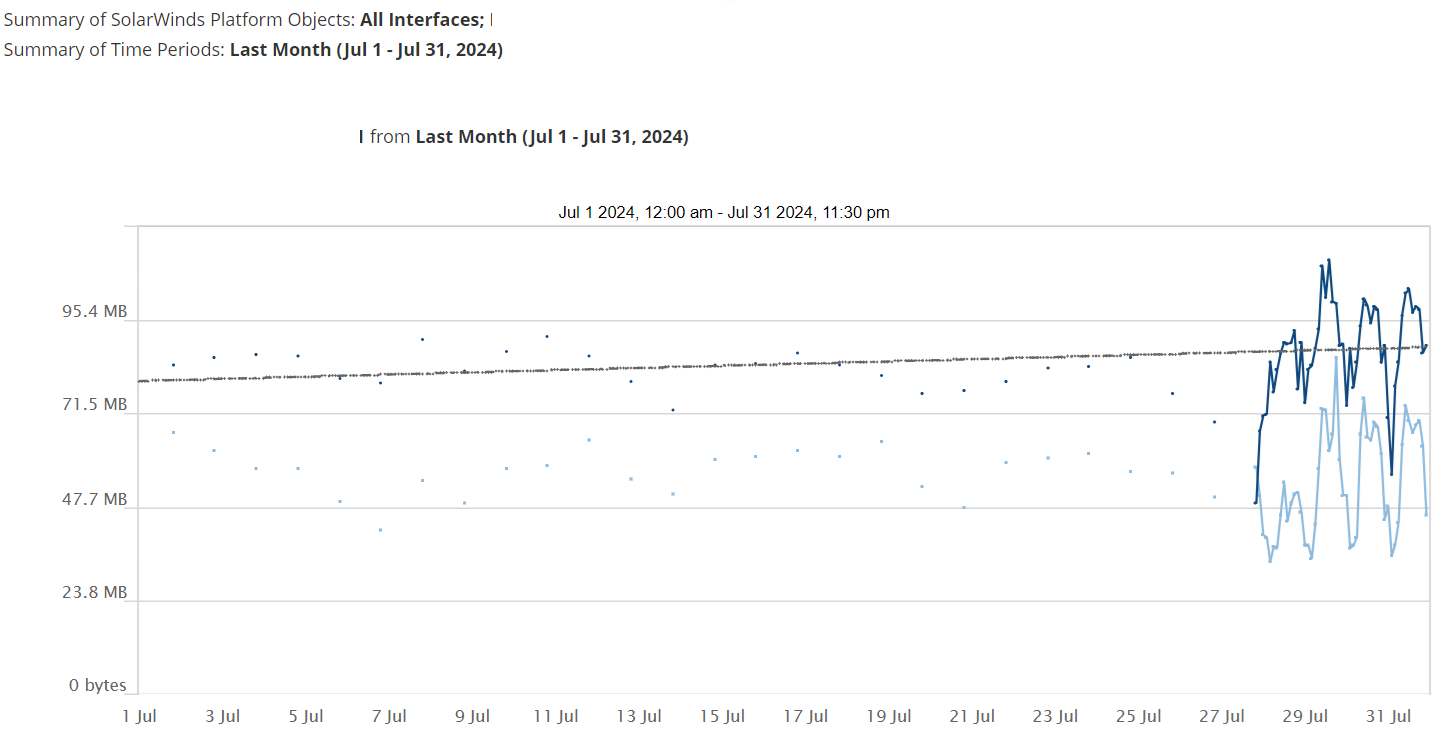
Greetings to the community, I am making a report of a monthly interface report for the month of July for example, but the graph shows me the following, Why does it show me activity from the last few days???
THX
your detailed retention settings are probably still at the default of 7 days, after 7 days you only have hourly averages so it shows the gap. You can edit the chart so the sample period is an hour and the gaps would go away, but you would lose detail during the 7 days.
Thank you very much for your answers, it has been very helpful. Now, where can I change that retention to 32 days?
What @mesverrum said - your retention settings have the data rolled up. However this would be your daily retention setting where the hourly data is rolled up into a single daily statistic, hence why you have a data point on each day. You would need to either run the report at the start of the following month (and maybe bump the hourly retention to 32 days), or modify the chart to a daily interval but you would lose the granularity of the last 7 days.
Thank you very much for the help.
Its under polling settingsdocumentation.solarwinds.com/.../core-polling-intervals-sw1826.htm