Hello,
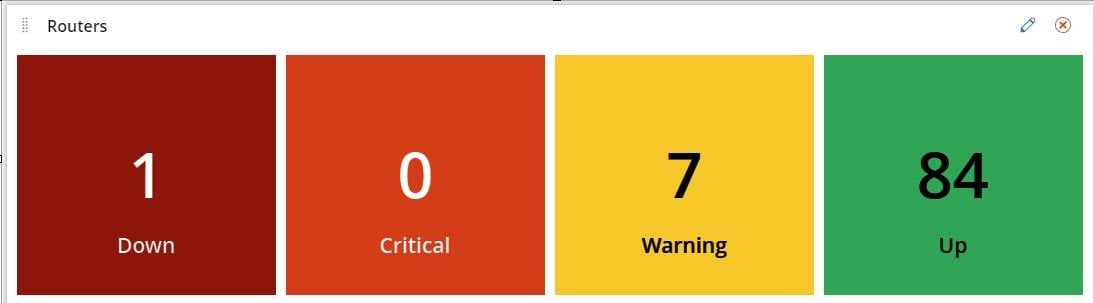
I've never created a modern dashboard. I'm trying to get a simple, but not to me, big numbers dashboard for management. We have our groups in this order. Routers/State/City/Node. The same goes for Firewalls, Firewalls/State/City/Node. I'm not putting the location due to security but our Data Center is group like this. Data Center A/Routers/Nodes, Data Center A/Switches/Nodes, Data Center A/Firewalls/Nodes, Data Center B/Routers/Nodes, Data Center B/Switches/Nodes, Data Center B/Firewalls/Nodes. I'm trying to group them all separately to show the number that is Down, Critical, Warning, UP for a total of 8 different Widgets. Not sure if this will help but we do also have custom properties Node_Category. Then we we put if it is n "Office Router", "Office Firewall" "Data Center A Router" etc. I have a screen shot of what I'm looking for.
Any help will be much appreciated.