I have a Counter based UnDP I'm charting using the 'Custom Chart' widget.
It plots just fine, the issue occurs when I zoom out by changing the displayed date range and the granularity of the Time axis (x-axis) changes from 1 min (the polling rate I'm using), to something larger (e.g. 2 mins). The Custom Chart seems to be hardcoded to combine values by averaging them, when I want them to be sum'd instead.
Does anyone know if there is a way around this? I'm hoping I've missed a configuration option, or there's another widget or way of doing things to get a sum instead of an average.
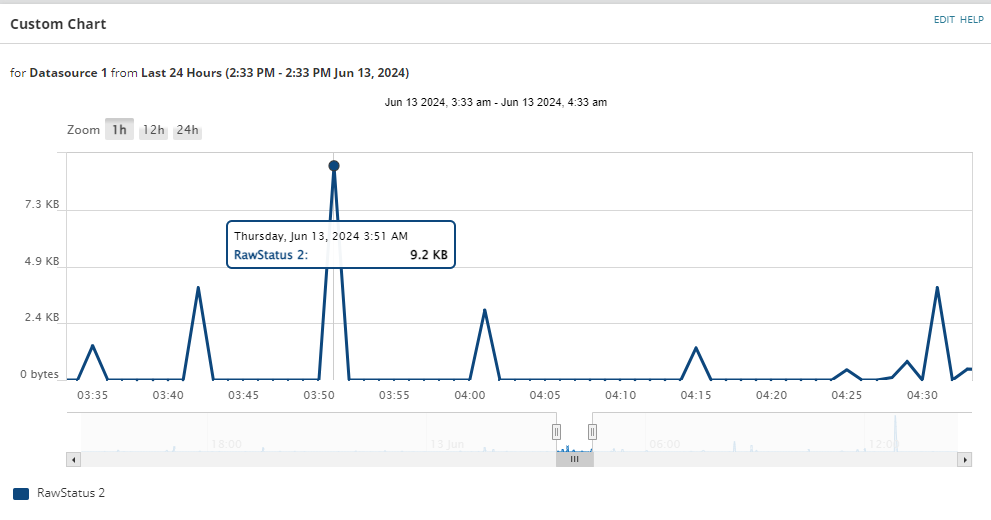
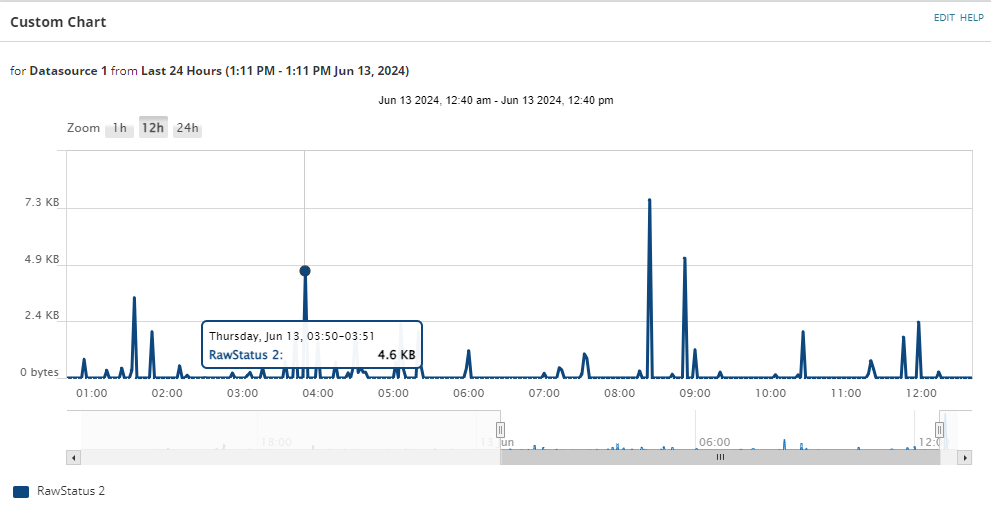
In the images below, see how the displayed value is halved because the Time interval on the bottom axis changes from 1 min to 2 mins, and the polled value it's combined with is a 0.
1 Min Intervals on the chart:
2 Min Intervals on the chart:
The SWQL code is as follows, I'm plotting the RawStatus value as this contains the Delta between the Current polled value and the Previous.
SELECT DateTime, RawStatus, RowID
FROM Orion.NPM.CustomPollerStatistics
WHERE CustomPollerAssignmentID = ''
AND RowID = '2'