Hi folks,
I have a question for you all, I am setting up / configuring a Modern Dashboard using a Table widget. The Table has 6 Headers (Environment, Up, Down, Critical, Warning, Unmanaged).
The the SWQL results display a Row per environment found in the CustomProperties Environment, the environment name will also include the total Nodes in that environment and the total Server Nodes state count per column.
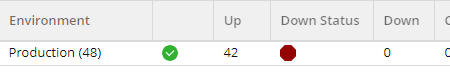
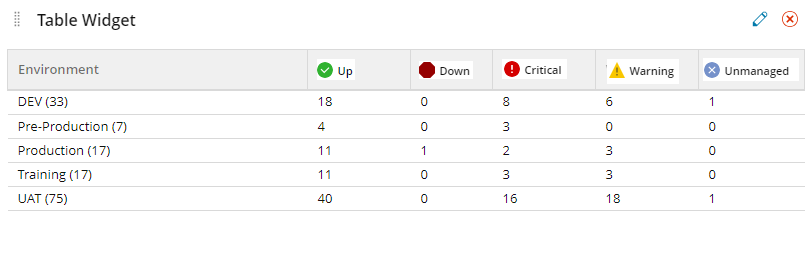
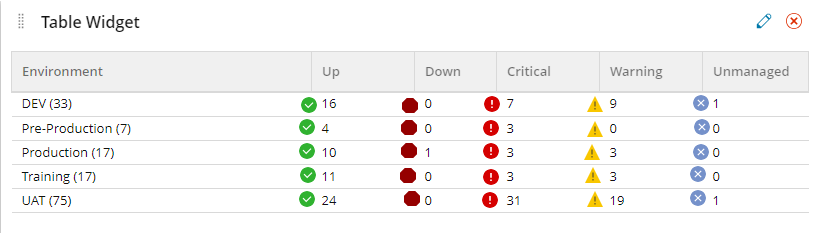
What I am trying to achieve, is for the State Icon to appear either in each of the Column Headers or next to the State Count figure. Can this be achieved ?
If not, then I'm sure SWQL Query will help someone with their environment with a simple modification to return either by Vendor or Production Type.
The SWQL Query to gather the information.
SELECT Concat(ncp.Environment, ' (', Count (n.NodeName),')') As Environment,
COUNT (CASE n.Status WHEN '1' THEN 'status_up' ELSE null END) AS Up,
COUNT (CASE n.Status WHEN '2' THEN 'status_down' ELSE null END) AS Down,
COUNT (CASE n.Status WHEN '14' THEN 'status_critical' ELSE null END) AS Critical,
COUNT (CASE n.Status WHEN '3' THEN 'status_warning' ELSE null END) AS Warning,
COUNT (CASE n.Status WHEN '9' THEN 'status_unmanaged' ELSE null END) AS Unmanaged

FROM Orion.Nodes AS n
JOIN Orion.NodesCustomProperties ncp On n.NodeID = ncp.NodeId
WHERE n.IsServer = True
Group By ncp.Environment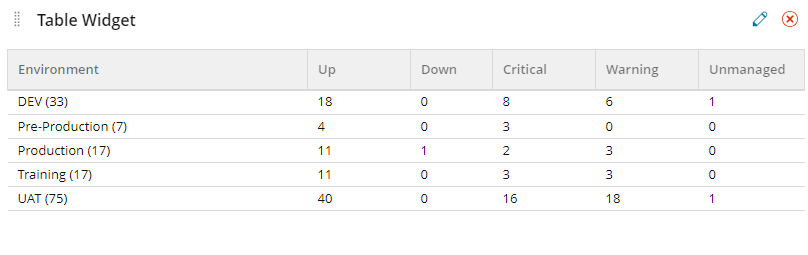
What I would like to make it easier/quicker to Identify Status is something like one of the following.
OR
Thank you in Advance for you help and sorry for my dodgy cut,copy,paste artwork.